- USD/CAD fails to keep the pullback from 1.3500 mark.
- A one-week-old falling trend line adds to the upside barriers.
- Key Fibonacci retracement levels restrict immediate declines, MACD teases the bulls.
USD/CAD retraces the latest moves while taking rounds to 1.3530, up 0.06% on a day, during the early Tuesday’s trading. The loonie pair earlier crossed 200-HMA amid fears of no US-China trade deal. Though, the following U-turn by the US policymaker joined likely aluminum tariffs on Canada to weigh on the quote.
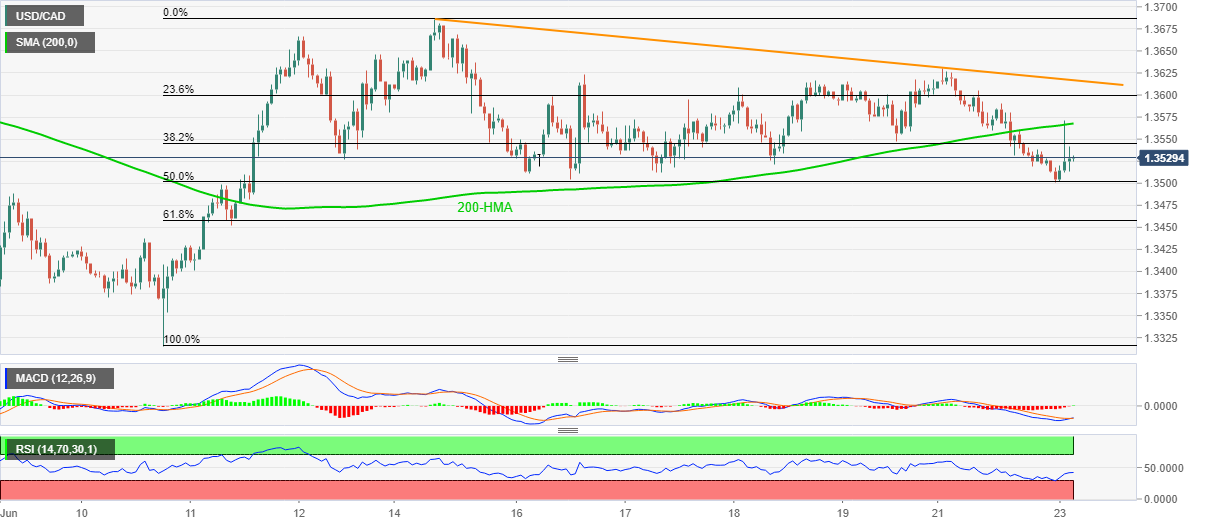
As a result, 50% Fibonacci retracement of the pair’s June 10-15 upside, near 1.3500, remains on the sellers’ radar, a break of which can drag the quote towards 1.3455 support level comprising 61.8% Fibonacci retracement.
During the quote’s additional weakness past-1.3455, 1.3430 and 1.3375/70 might entertain sellers ahead of highlighting the monthly low close to 1.3315.
Meanwhile, a clear upside past-200-HMA level of 1.3565 could escalate the latest recovery moves to the one-week-old falling trend line, at 1.3618 now.
It should, however, be noted that the pair’s sustained rise past-1.3618 enables the bulls to probe the June-15 top surrounding 1.3685/90.
USD/CAD hourly chart
Trend: Sideways
