- USD/CAD remains on the back foot near the monthly low.
- Weak RSI conditions can trigger bounce off falling wedge support.
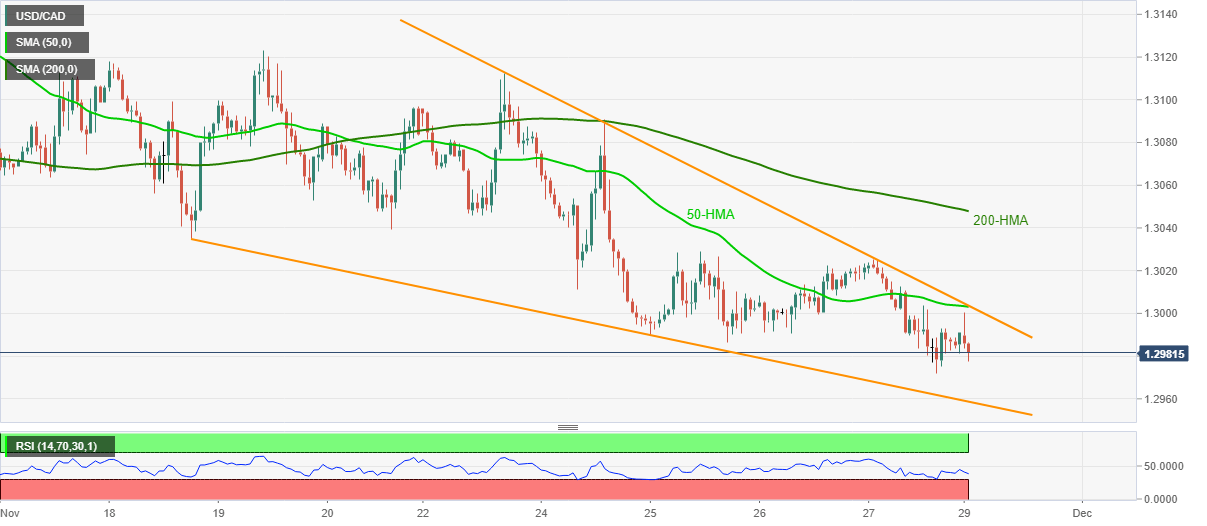
- 200-HMA offers an additional filter to the upside past-bullish pattern.
USD/CAD drops to 1.2978, down 0.10% intraday, during the early Monday morning in Asia. In doing so, the pair declines for the second day while staying around the monthly bottom, teased on Friday, inside a bullish chart formation.
While sustained trading below the key HMAs keeps the USD/CAD sellers hopeful, RSI conditions indicate a pullback move from the support line of the stated rising wedge formation on the hourly (1H) chart.
However, USD/CAD bears’ refrain from respecting the bullish chart pattern will challenge the multi-month low, marked earlier in November, around 1.2930.
On the contrary, a confluence of 50-HMA and resistance line of the rising wedge, near 1.3000, restricts the pair’s short-term upside.
Even if the quote manages to cross 1.3000, 200-HMA close to 1.3050 will stop the USD/CAD buyers from targeting the 1.3100 threshold.
USD/CAD hourly chart
Trend: Pullback expected
