- USD/CAD fades bounce off 1.2780 as 200-HMA, 50% of Fibonacci retracement offers immediate resistance.
- 100-HMA, falling trend line from December 21 adds to the upside filters amid sluggish MACD.
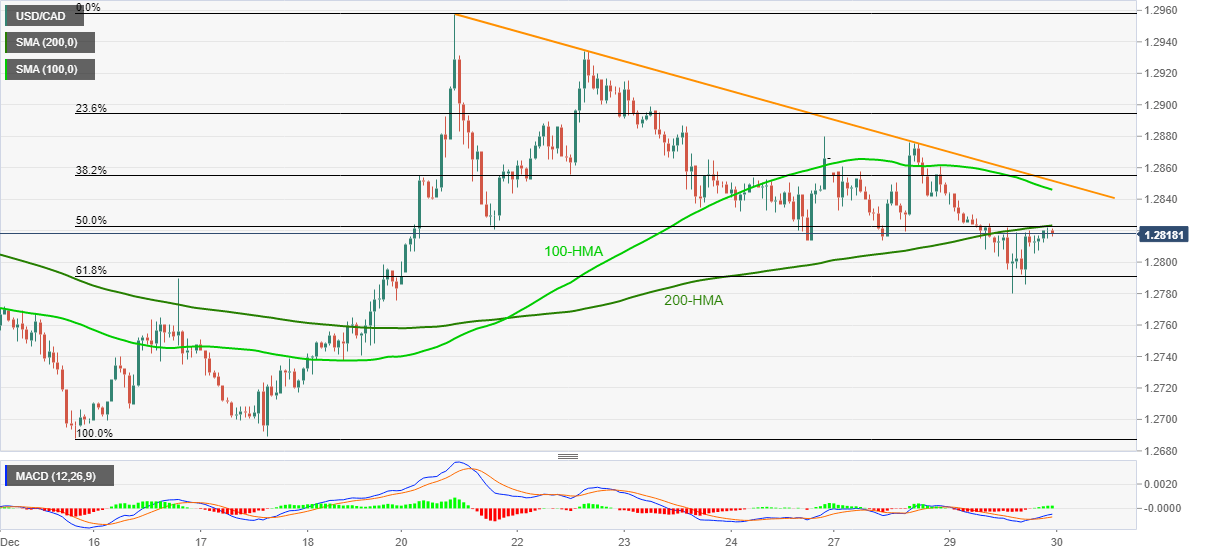
USD/CAD steps back from 200-HMA to 1.2817 during Wednesday’s Asian session. In doing so, the loonie pair fails to extend corrective pullback from 61.8% Fibonacci retracement of December 15-21 upside.
Not only 200-HMA and a 50% Fibonacci retracement confluence that restricts the quote’s immediate upside around 1.2825 but 100-HMA and a short-term descending trend line also challenge the USD/CAD buyers. Further probe the upside momentum is receding strength of the bullish MACD.
That said, USD/CAD sellers eye revisit of 61.8% Fibonacci retracement, at 1.2791, during the fresh downside. However, the 1.2800 round-figure may offer an intermediate halt.
In a case where the bears dominate past-1.2790, the monthly low around 1.2688 can return to the charts.
Alternatively, an upside clearance of 1.2825 immediate resistance confluence will aim for the 100-HMA level of 1.2846 before confronting a seven-day-old trend line resistance near 1.2852.
It should, however, be noted that the USD/CAD run-up beyond 1.2852 enables it to probe the monthly top, currently around 1.3010.
USD/CAD hourly chart
Trend: Further weakness expected
