- US GDP contracted in Q2.
- Investors expect a drop in Canada’s GDP.
- There is a bullish RSI divergence in the charts.
Today’s USD/CAD price analysis is bearish after data from the Commerce Department indicated that the US GDP decreased at an annualized rate of 0.9 percent in the second quarter. This comes after the first-quarter decrease of 1.6 percent.
–Are you interested to learn more about forex options trading? Check our detailed guide-
“For now, the market is running with the idea that slowing growth will cause the Fed to blink and that we’re entering a recession,” said Mazen Issa, senior FX strategist at TD Securities in New York.
The information came as the Fed pledged on Wednesday to continue fighting against the highest level of inflation in the United States since the 1980s, even if doing so results in a “sustained period” of economic deterioration and a sluggish labor market.
“It’s certainly going to be an interesting balance between hopefully inflation moderating but then consumers having to face a more challenging economic backdrop,” Mona Mahajan, senior investment strategist at Edward Jones, said. “We don’t see the scope for a deep and prolonged recession, but the slowdown the market is pricing in is likely to come to fruition in the next couple of quarters, maybe even into the first quarter of 2023.”
USD/CAD key events today
USD/CAD investors will see the changes in the price of goods and services bought by US consumers for consumption, excluding food and energy. This measure will be released as the PCE price index.
Canada will also release Gross Domestic Product (GDP) data for May, which is expected to drop from 0.3% to -0.2%.
USD/CAD technical price analysis: Bearish wedge
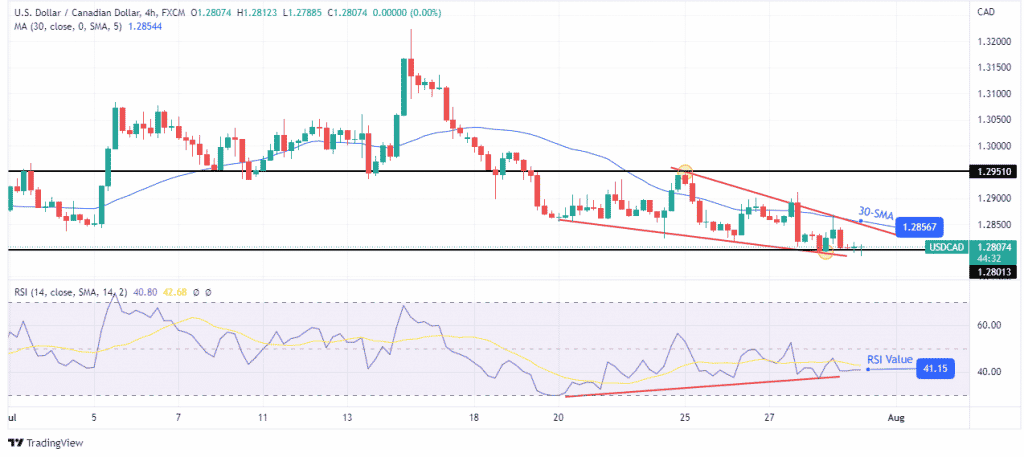
Looking at the 4-hour chart, we see the price trading within a bearish wedge. The price is trading below the 30-SMA, showing a downtrend. A bearish wedge in a downtrend indicates that bears are no longer making steep moves and can sometimes show weakness.
–Are you interested to learn about forex robots? Check our detailed guide-
This weakness can also be seen in the RSI, which has made a bullish divergence. This divergence usually comes before a trend reversal. However, the trend will only reverse if the bulls can break above the 30-SMA and the wedge resistance. If this happens, the price might retest the July 25 resistance at 1.29510.
Looking to trade forex now? Invest at eToro!
67% of retail investor accounts lose money when trading CFDs with this provider. You should consider whether you can afford to take the high risk of losing your money.
