- USD/CAD trades 0.07% higher in a lacklustre session on Tuesday.
- There was a small break higher but the bulls failed to keep control of the move.
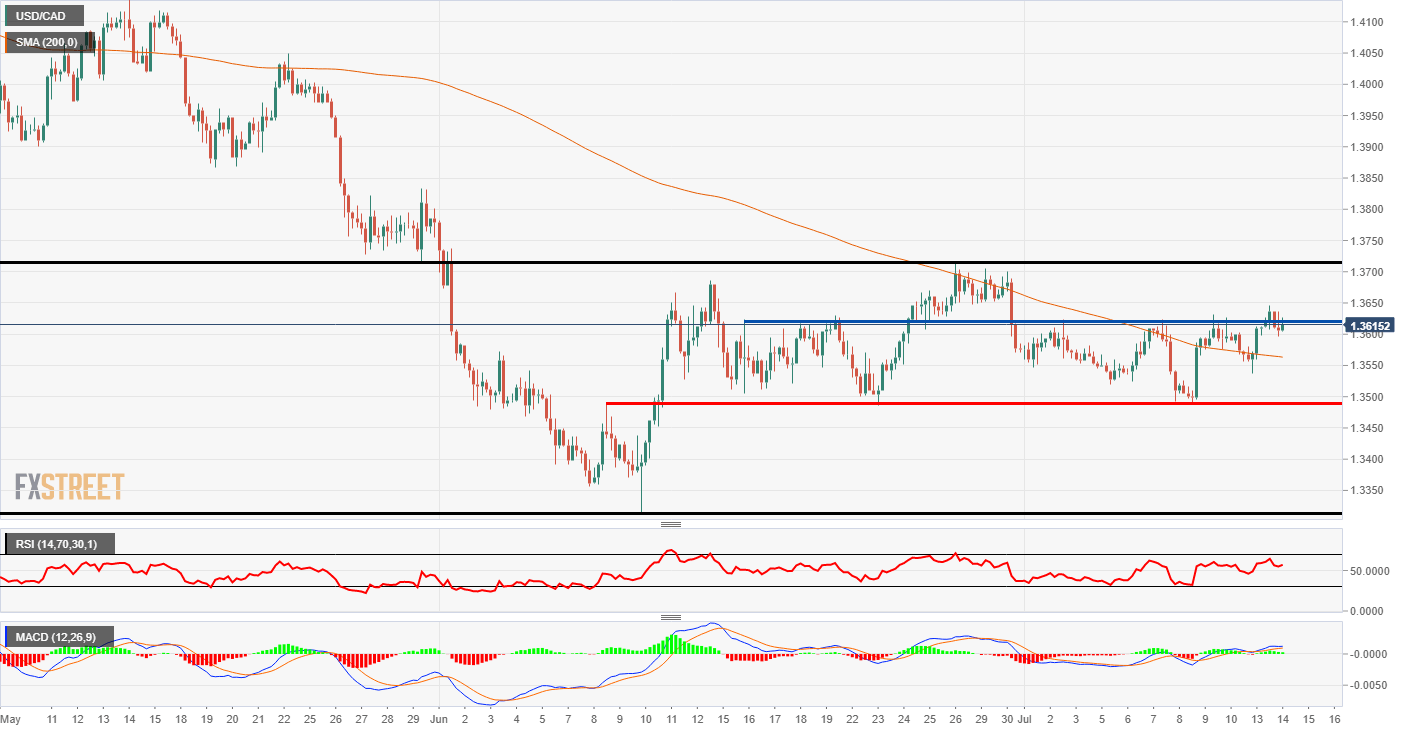
USD/CAD 4-hour chart
USD/CAD has been pretty slow on Monday as the market seems to lack any firm direction. The two black lines on the chart represent a two big figure consolidation range and the price needs to break out. There has been some good news as the price broke the 55 Simple Moving Average and also made a new wave high.
Looking at the indicators, the Relative Strength Index has risen above the mid-line. This could be bullish and there is space to move into the overbought zone on the upside. The MACD is also positive, the histogram is green and the signal lines have just moved above the zero area too.
On the daily timeframe, the price is still in a downtrend making lower lows and lower highs. This move is currently a retracement but if the price breaks 1.3715 then a move higher could be taken more seriously. Until then keep an eye on the consolidation areas for breaks and clues.
Additional levels
