- The USD/CAD pair could register sharp movement after the US NFP release.
- A new lower low may activate a larger drop.
- A valid breakout above 1.2901 could validate further growth.
The USD/CAD price seems undecided in the short term. It moves somehow sideways. That’s why we have to wait for strong confirmation before taking action. It’s traded at 1.2833 at the time of writing, and it’s trapped between 1.2813 today’s low and 1.2868 yesterday’s high.
–Are you interested in learning more about spread betting brokers? Check our detailed guide-
The traders are waiting for the US and Canadian economic data, which could bring high volatility and sharp movements. Today, the fundamentals will move the markets. That’s why you have to be careful. Anything could happen.
Technically, the currency pair has shown some signs of exhaustion after reaching a resistance area. Still, as long as the Dollar Index resumed its growth, the currency pair remained bullish. However, despite the bullish bias, the DXY retreated in the last hours after registering another false breakout above the 103.65 – 103.82 resistance zone.
The US Non-Farm Employment Change is expected at 390K in April versus 431K in March. As a result, average Hourly Earnings may report a 0.4% growth, while the Unemployment Rate could drop to 3.5% from 3.6% in March. On the other hand, the Canadian Unemployment Rate could drop from 5.3% to 5.2%, while Employment Change could come in at 39.5K versus 72.5K in the previous reporting period.
USD/CAD price technical analysis: Range pattern
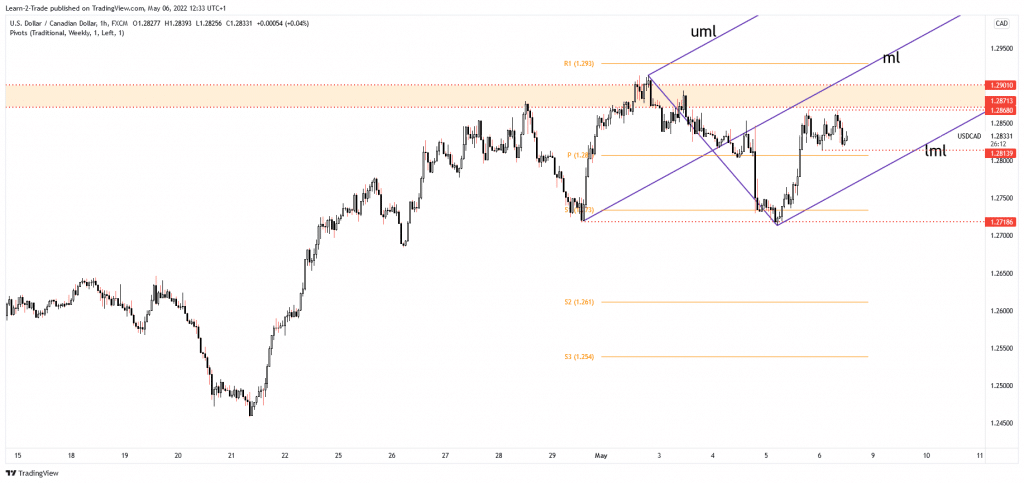
The USD/CAD pair rebounded after finding support on the 1.2718 key level. 1.2771 – 1.2901 represents a resistance zone, so it remains to see how it will react after the high-impact economic figures.
Better than expected US data could boost the pair, while worse than expected could punish the USD. Personally, I’m expecting to see sharp movements. That’s why it’s risky to go long or short before the data dump. However, a valid breakout above the 1.2901 may signal an upside continuation.
–Are you interested in learning more about Australian brokers? Check our detailed guide-
On the other hand, registering only false breakouts above the 1.2871 – 1.2901 area may signal a potential sell-off. Also, we cannot exclude an extended sideways movement. A larger downside movement could be activated only by a valid breakdown below 1.2718, by a new lower low.
Looking to trade forex now? Invest at eToro!
68% of retail investor accounts lose money when trading CFDs with this provider. You should consider whether you can afford to take the high risk of losing your money
