- The USD/CAD pair maintains a bullish bias after registering only false breakdowns below 1.2448.
- A valid breakout above the upper median line (UML) could activate an upside continuation.
- A bearish pattern around resistance could announce a potential sell-off.
The USD/CAD price climbed as much as the 1.2479 level today but now is traded lower at the 1.2461 level. The price has slipped lower as the Dollar Index seems undecided around the 94.50 static resistance.
-If you are interested in knowing about ETF brokers, then read our guidelines to get started.
Still, you should keep in mind that the DXY is bullish; further gains should boost the USD, which will be expected to appreciate versus its rivals.
The pair is bullish, so the further rise is favored. In addition, the greenback received more support from the United States economy today. As you already know, the Non-Farm Employment Change, the NFP, was reported at 531K in October, far above 455K expected compared to 312K reported in September. Surprisingly, the Unemployment Rate dropped from 4.8% to 4.6%, below 4.7% expected. In addition, the Average Hourly Earnings registered a 0.4% gain in October, matching expectations.
On the other hand, the Canadian data have come in mixed. The Unemployment Rate dropped from 6.9% to 6.7%, below 6.8% expected, but unfortunately, the Employment Change was reported at 31.2K below 42.0K expected versus 157.1K in the previous reporting period.
USD/CAD price technical analysis: Dynamic resistance to pause rallies
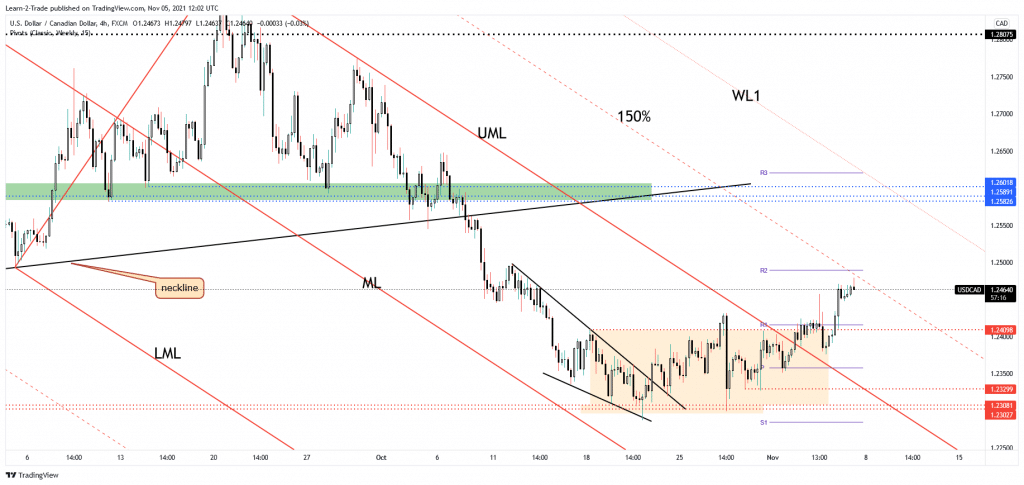
The USD/CAD price registered sharp movements in both directions right after the NFP. It’s trapped between 1.2471 and 1.2448. After registering two false breakdowns from this range, the pair could try to make an upside breakout.
-Are you looking for high leveraged forex brokers? Take a look at our detailed guideline to get started-
Technically, the 150% Fibonacci line stands as a dynamic resistance. So, only a valid breakout above the 1.2471 and through the 150% Fibonacci line could announce an upside continuation. Conversely, making only false breakouts or printing a bearish pattern could announce that the upside is over and that the sellers could take the lead.
From the technical point of view, the USD/CAD maintains a bullish outlook after failing to reach and retest the upper median line (UML) and the weekly pivot point of (1.2358). Also, making a new higher high, closing above 1.2457, signaled strong upside pressure.
Looking to trade forex now? Invest at eToro!
68% of retail investor accounts lose money when trading CFDs with this provider. You should consider whether you can afford to take the high risk of losing your money.
