- USD/CAD is trading 0.21% lower on the session as the market waits for the FOMC on Wednesday.
- There have been a few higher highs higher low waves on the 30-minute chart.
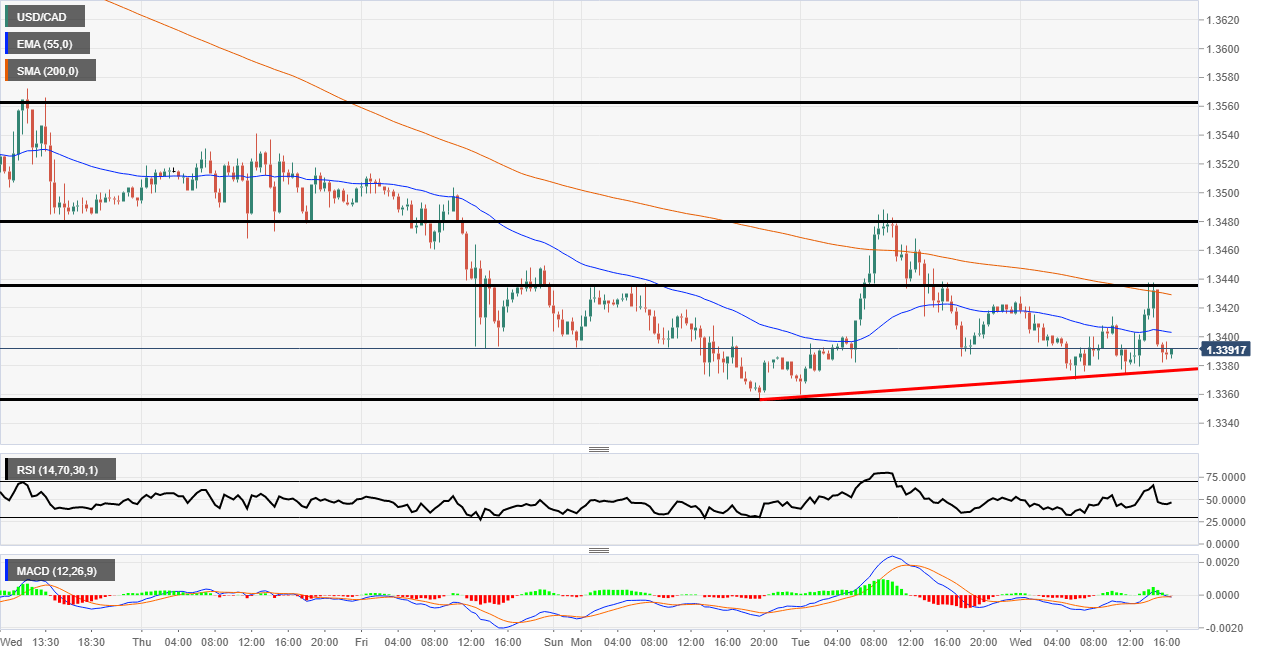
USD/CAD 30-min chart
USD/CAD has paused from its relentless downtrend ahead of the FOMC rate decision and press conference on Wednesday. The pair has now made a higher high higher low pattern which could mean the market is starting to base out.
The MACD histogram has turned green and pushed higher and the signal lines are flirting with the zero line too. Sometimes as volatility becomes thin ahead of big events the histogram bars do become flat like they are in the chart below before the event inspires some momentum.
The price bounced off the 200 Simple Moving Average and used it as a resistance zone to trade lower. This makes the 1.3440 level an important resistance intraday as it has been respected a few times now.
On the downside, the key level is now 1.3356, if this level breaks then the downtrend could continue to support zones on higher timeframes. The market is firmly with the bears at the moment. Let’s see if the FOMC can inspire some restbite.
Additional levels
