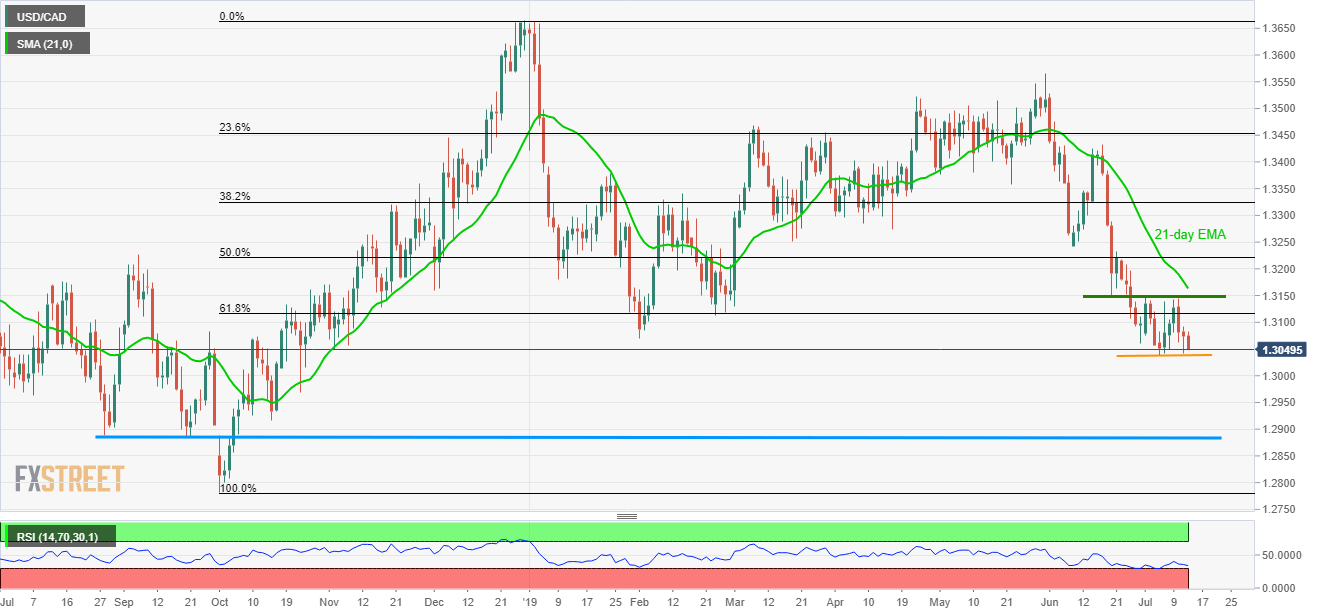
- Failure to rise past-1.3144/51 drags the USD/CAD pair down to revisit near-term horizontal support area.
- 21-day EMA offers additional resistances on the upside.
- 1.2970, 1.2890/85 can please sellers during an additional downpour.
Having pulled back from 1.3151/44 resistance-area, including latest tops and June 20 bottom, USD/CAD aims to revisit 1.3042/38 multiple support zone during early Friday.
Not only the strength of the horizontal rest-region that confine the quote’s declines during last-week but oversold levels of 14-day relative strength index (RSI) also questions bears.
If at all sellers refrain from respecting 1.3038 support-zone, late-October 2018 low near 1.2970 and 1.2890/85 regions including August and September 2018 bottoms can flash on their radar.
Alternatively, 61.8% Fibonacci retracement of the late-2018 swing low to an early year high, around 1.3116 offers immediate resistance to the pair ahead of highlighting 1.3144/51 resistance area.
It should also be noted that 21-day exponential moving average (EMA) at 1.3163 acts as an additional upside resistance for buyers to watch.
USD/CAD daily chart
Trend: Bearish
