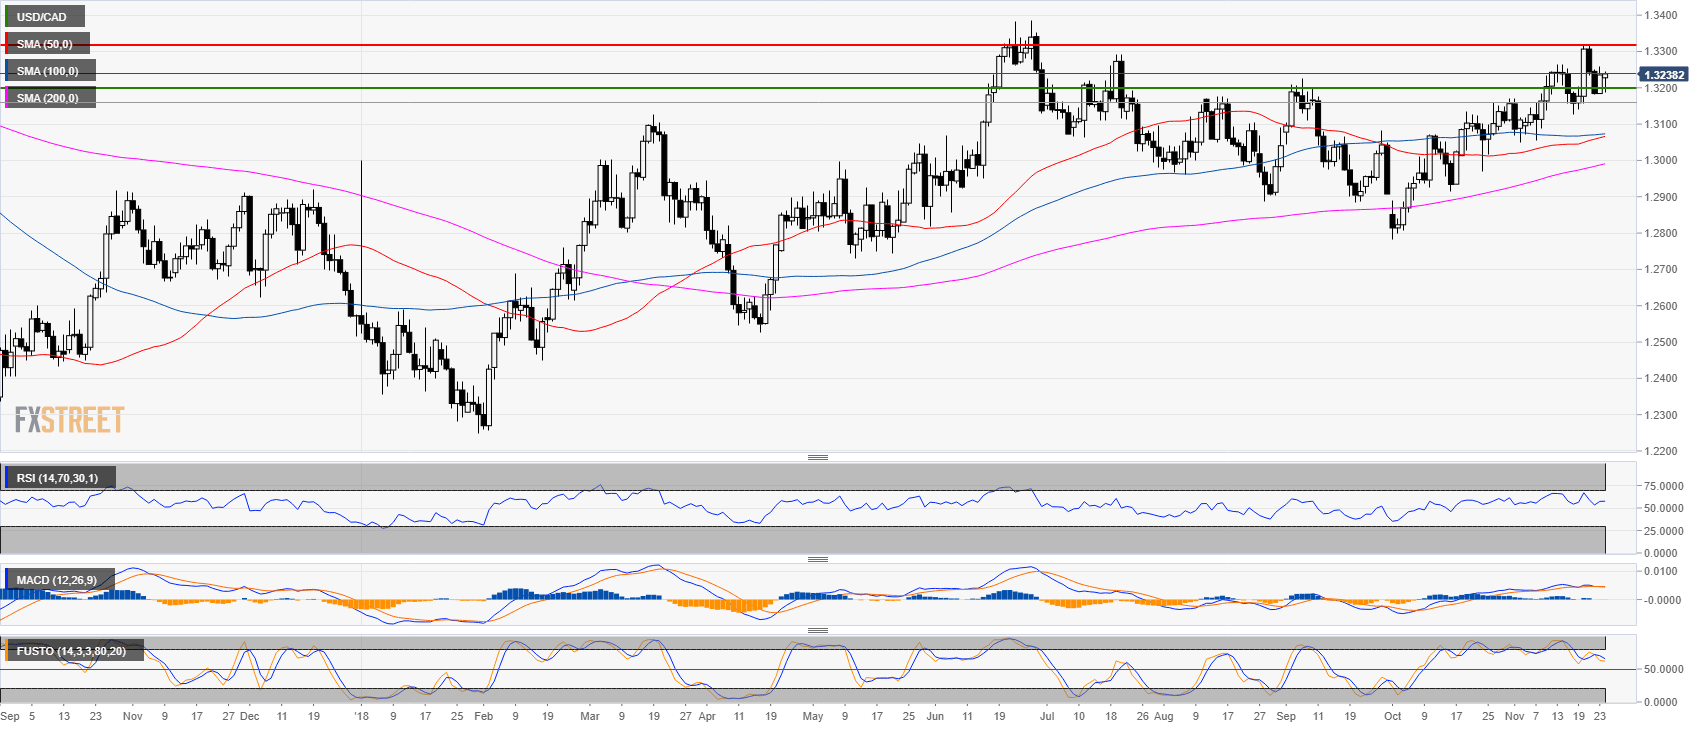
USD/CAD daily chart
- USD/CAD is trading in a bull trend above the 50, 100 and 200-period simple moving averages (SMAs).
- The RSI and Stochastic are above 50 while the MACD is neutral.
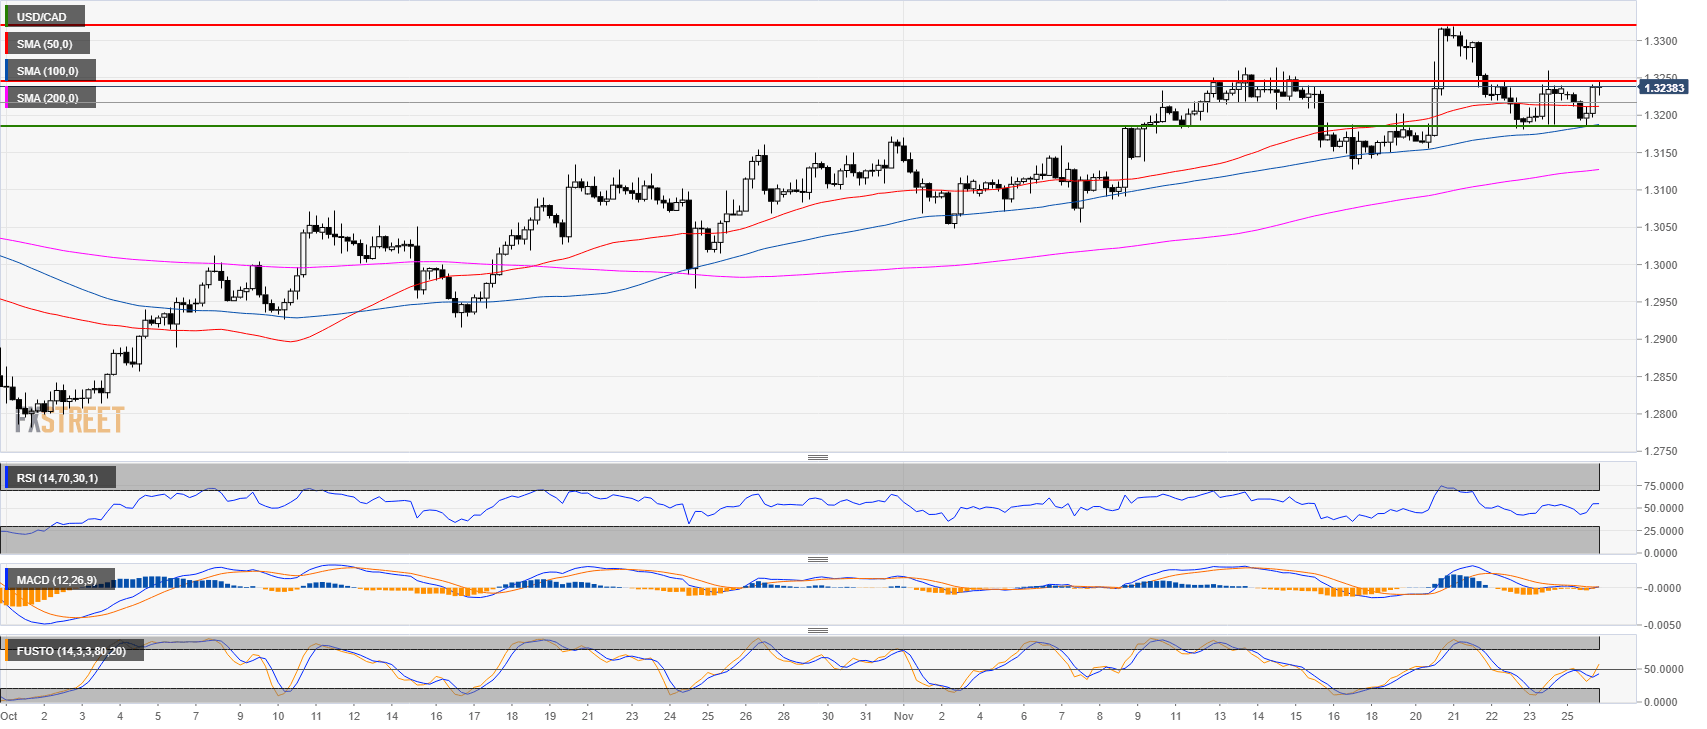
USD/CAD 4-hour chart
- USD/CAD is trading above its main SMAs while technical indicators are somewhat neutral.
- RSI is above 50, MACD is quite neutral and the Stochastic is below the 50 line.
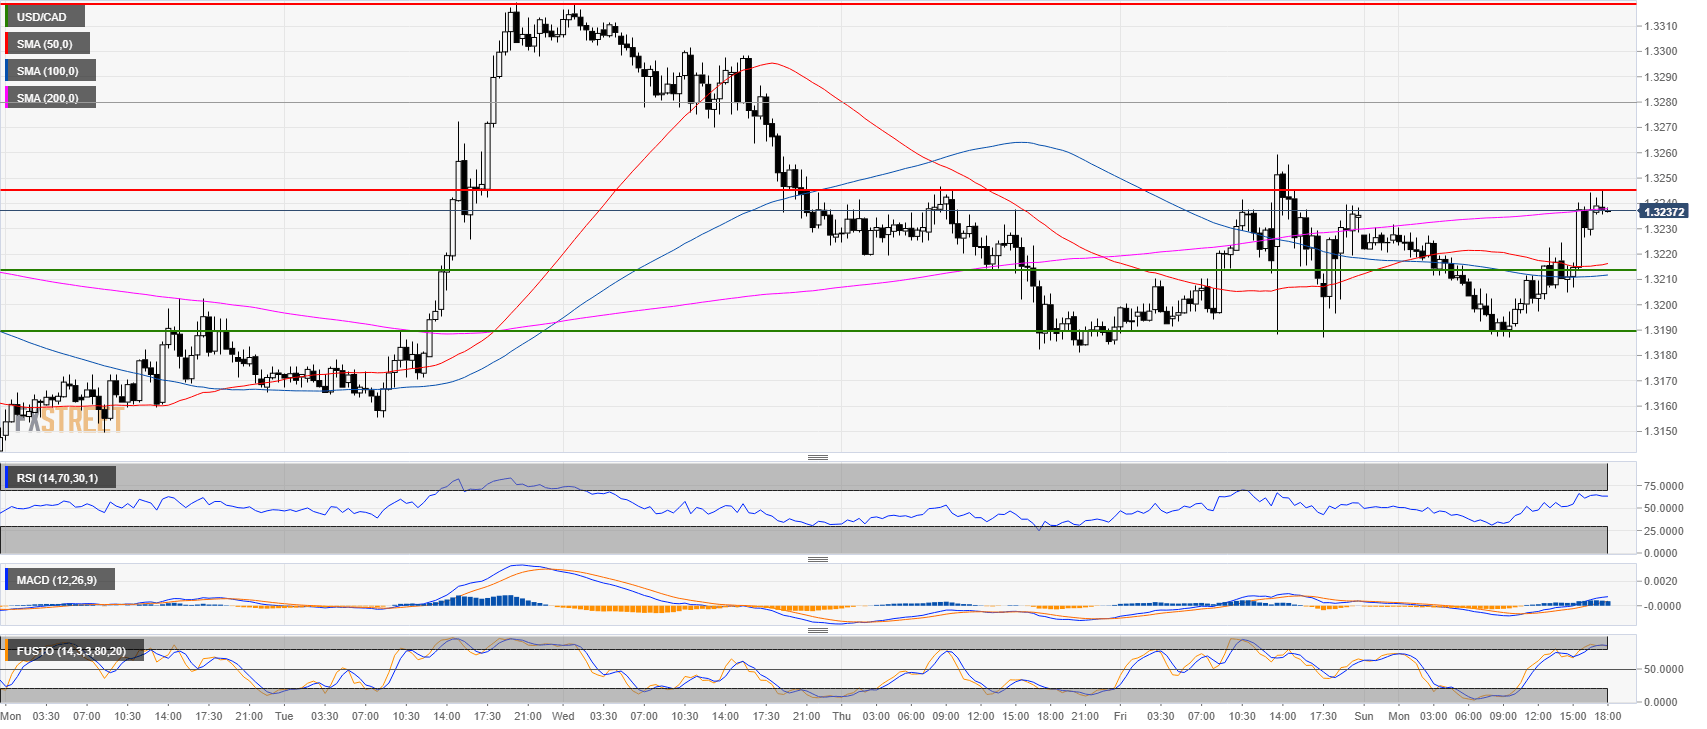
USD/CAD 30-minute chart
- USD/CAD is likely meeting strong resistance at the 1.3240 level and the 200 SMA.
- A pullback down to 1.3215 and 1.1390 can be next.
Additional key levels
USD/CAD
Overview:
Today Last Price: 1.3237
Today Daily change: 2.0 pips
Today Daily change %: 0.0151%
Today Daily Open: 1.3235
Trends:
Previous Daily SMA20: 1.3176
Previous Daily SMA50: 1.3062
Previous Daily SMA100: 1.3072
Previous Daily SMA200: 1.2982
Levels:
Previous Daily High: 1.326
Previous Daily Low: 1.3184
Previous Weekly High: 1.332
Previous Weekly Low: 1.3142
Previous Monthly High: 1.3172
Previous Monthly Low: 1.2783
Previous Daily Fibonacci 38.2%: 1.3231
Previous Daily Fibonacci 61.8%: 1.3213
Previous Daily Pivot Point S1: 1.3193
Previous Daily Pivot Point S2: 1.315
Previous Daily Pivot Point S3: 1.3117
Previous Daily Pivot Point R1: 1.3269
Previous Daily Pivot Point R2: 1.3302
Previous Daily Pivot Point R3: 1.3344
