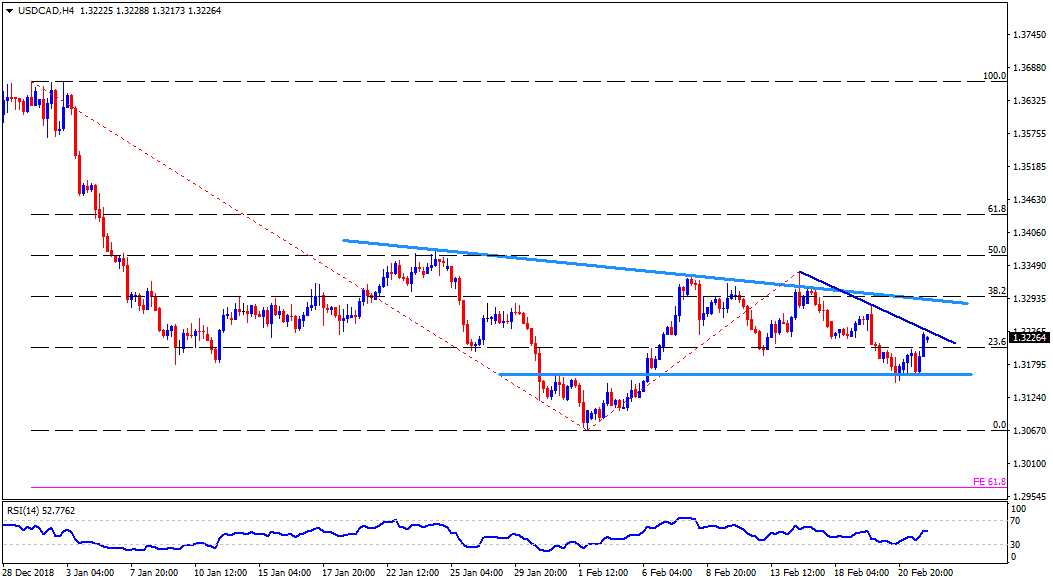
- USD/CAD trades around 1.3230 at the beginning of the Asian session on Friday.
- The pair recently recovered from late-January highs but an immediate downward sloping trend-line joining a week’s high, at 1.3245, may challenge the up-moves.
- Given the pair’s successful break of 1.3245, it becomes capable of aiming the 1.3295-1.3300 resistance-region comprising another descending resistance-line connecting highs marked since January 24 and 38.2% Fibonacci retracement of the pair’s late-December to early February downturn.
- Should there be additional upside past-1.3300, 1.3330 and 50% Fibonacci retracement near 1.3365 can please the buyers.
- Meanwhile, 1.3165 can offer immediate support to the pair during its pullback, a break of which can recall 1.3120 and 1.3080 rest-points on the chart.
- In a case where prices keep drowning past-1.3080, the current month low around 1.3065 may offer an intermediate halt, which if ignored could trigger the pair’s plunge to 1.2970, including 61.8% Fibonacci expansion of its moves since the end of December 2018.
USD/CAD 4-Hour chart
Additional important levels:
Overview:
Today Last Price: 1.323
Today Daily change: 53 pips
Today Daily change %: 0.40%
Today Daily Open: 1.3177
Trends:
Daily SMA20: 1.3223
Daily SMA50: 1.3352
Daily SMA100: 1.3256
Daily SMA200: 1.3154
Levels:
Previous Daily High: 1.322
Previous Daily Low: 1.315
Previous Weekly High: 1.3341
Previous Weekly Low: 1.3196
Previous Monthly High: 1.3664
Previous Monthly Low: 1.3118
Daily Fibonacci 38.2%: 1.3177
Daily Fibonacci 61.8%: 1.3194
Daily Pivot Point S1: 1.3144
Daily Pivot Point S2: 1.3112
Daily Pivot Point S3: 1.3074
Daily Pivot Point R1: 1.3215
Daily Pivot Point R2: 1.3253
Daily Pivot Point R3: 1.3285
