- USD/CAD confronts 200-day SMA, a falling resistance line since late-May.
- 50% of Fibonacci retracement adds to the resistance.
- 100-day SMA acts as a near-term firm support.
The USD/CAD pair’s run-up to five-week high seems to witness a bumpy road ahead. The quote takes the bids to 1.3280 during the Asian session on Wednesday.
The downward sloping trend line since May 30, coupled with 200-day Simple Moving Average (SMA), near 1.3277/80 acts as immediate upside barriers for the pair’s latest rise. Also increasing hardships for buyers is 50% Fibonacci retracement level of May-July declines at 1.3290.
In case bulls manage to dominate past-1.3290, the 1.3350/55 area including the previous month high and 61.8% Fibonacci retracement will be in the spotlight.
On the downside, 38.2% Fibonacci retracement level of 1.3225 offers nearby rest during the pair’s pullback, a break of which could recall a 100-day SMA level of 1.3205.
It should be noted that the two-week-old rising support line around 1.3160 could question sellers below 1.3205.
USD/CAD daily chart
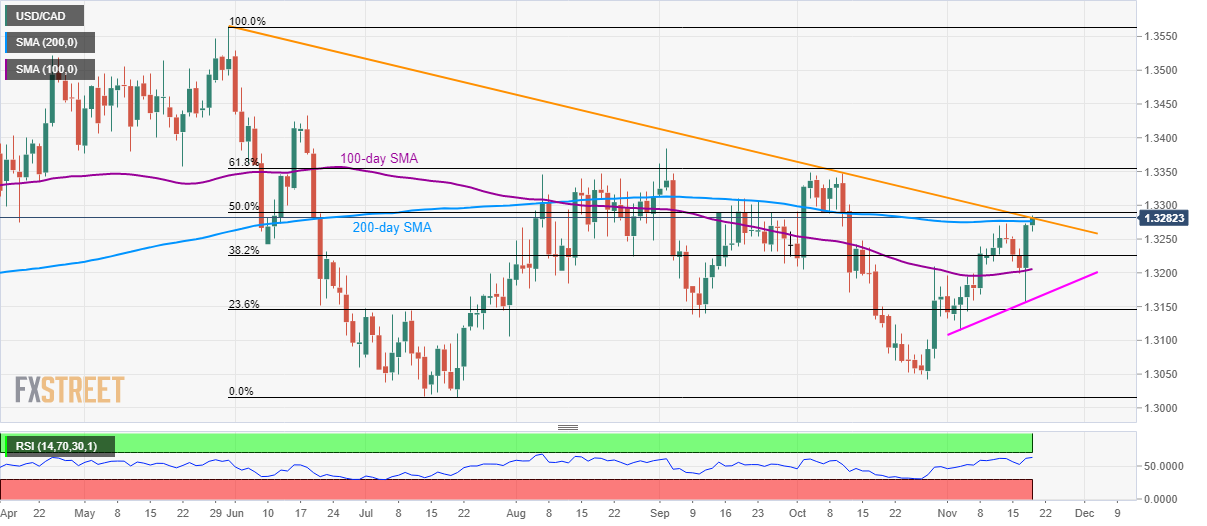
Trend: Pullback expected
