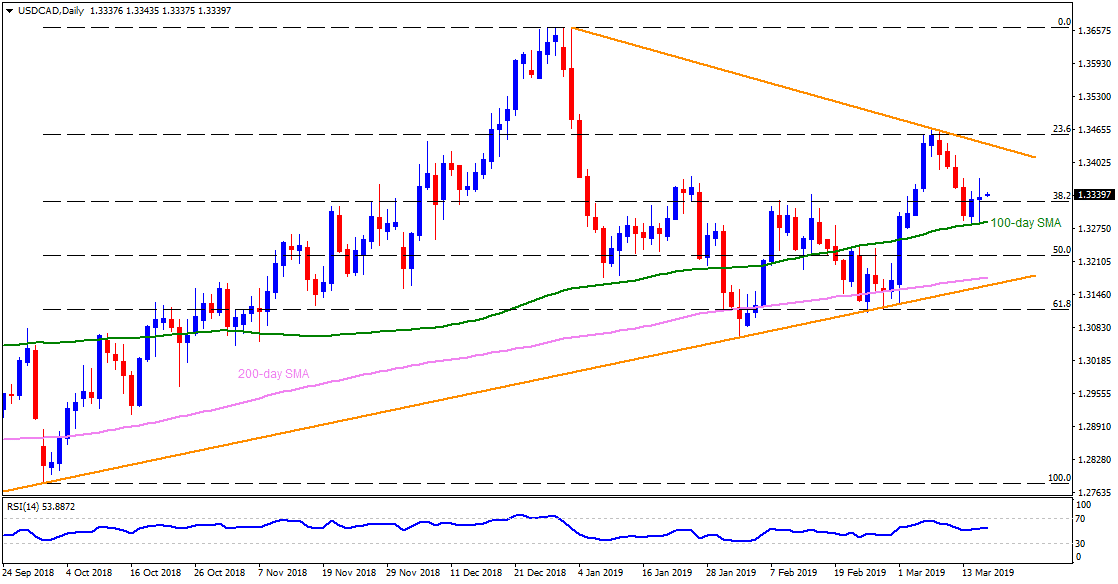
USD/CAD daily chart
- USD/CAD trades near 1.3340 at the initial Asian session on Monday.
- The pair bounced off 100-day simple moving average (SMA) during Thursday and Friday, making 1.3285 as strong near-term support.
- However, 1.3370/75 area comprising highs of January 23-24 and March 13-15 becomes immediate upside barrier for the buyers to conquer.
- Should the quote rallies past-1.3370, a descending resistance-line joining highs of January and March at 1.3440 could gain market attention as it holds the gate for the pair’s further upside to 1.3470 and 1.3500 resistance levels.
- Alternatively, pair’s decline below 1.3285 can push sellers toward 50% Fibonacci retracement of October – December upside near 1.3220.
- It needs to be noted that additional downside beneath 1.3220 may find it hard to sustain as 200-day SMA level of 1.3180 and a five-month-old upward sloping support-line at 1.3160 can challenge bears.
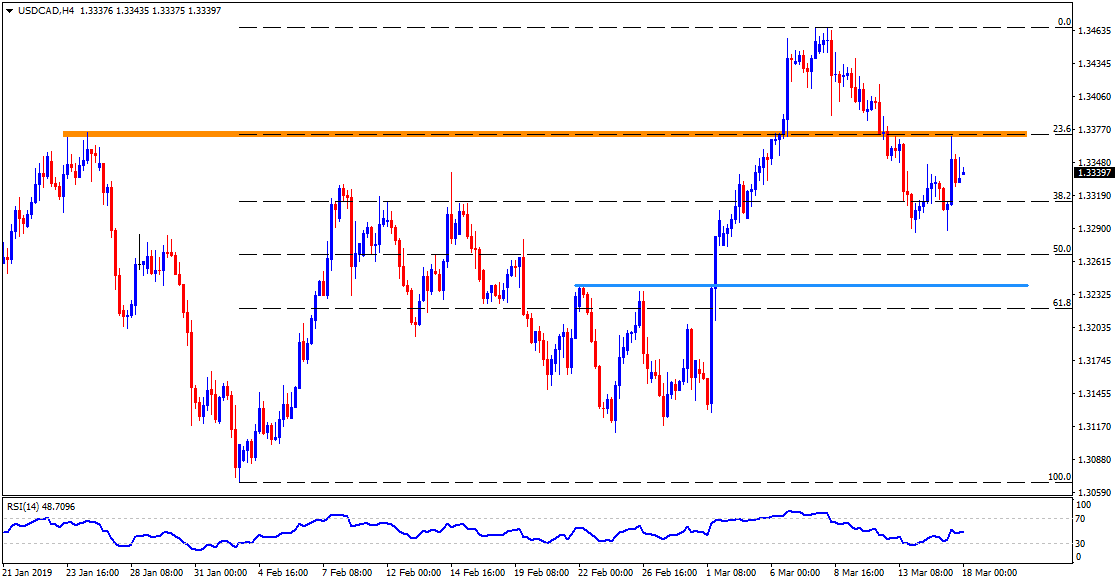
USD/CAD 4-Hour chart
- A horizontal-line comprising February 22 high near 1.3240 can offer an intermediate halt to price decline under 1.3285 toward 1.3220.
- 1.3415 may act as a buffer between 1.3375 and 1.3440.
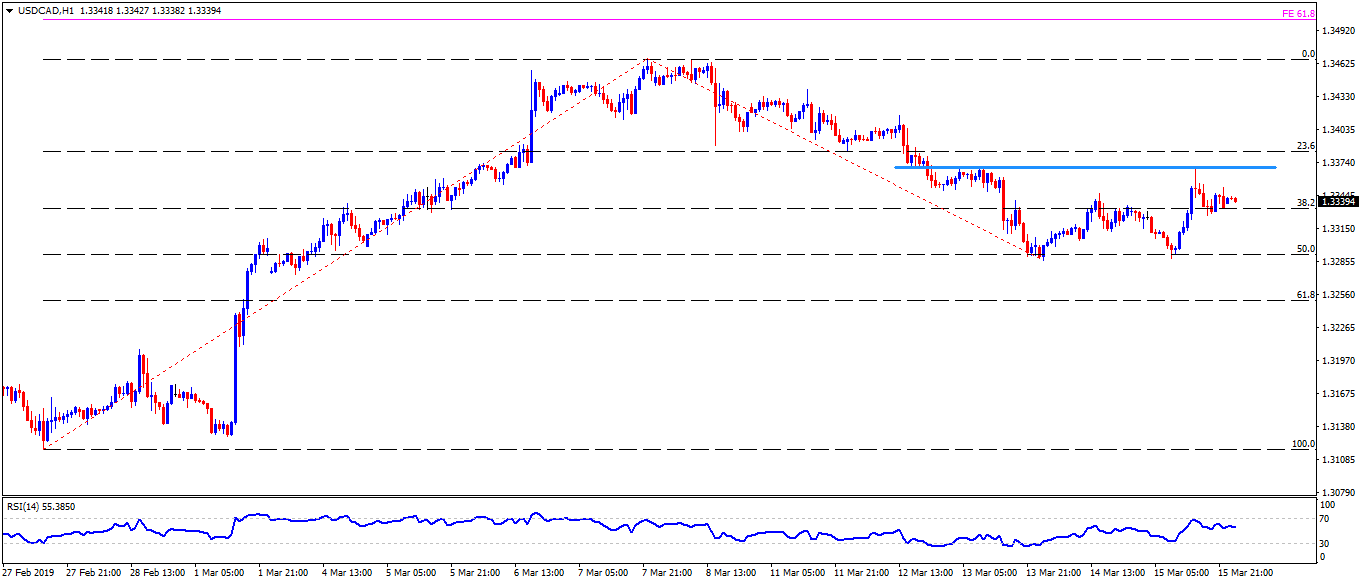
USD/CAD hourly chart
- 1.3200 and 1.3130 are additional supports that come forward on the hourly chart.
- 1.3400 can be considered as an extra upside level to watch.