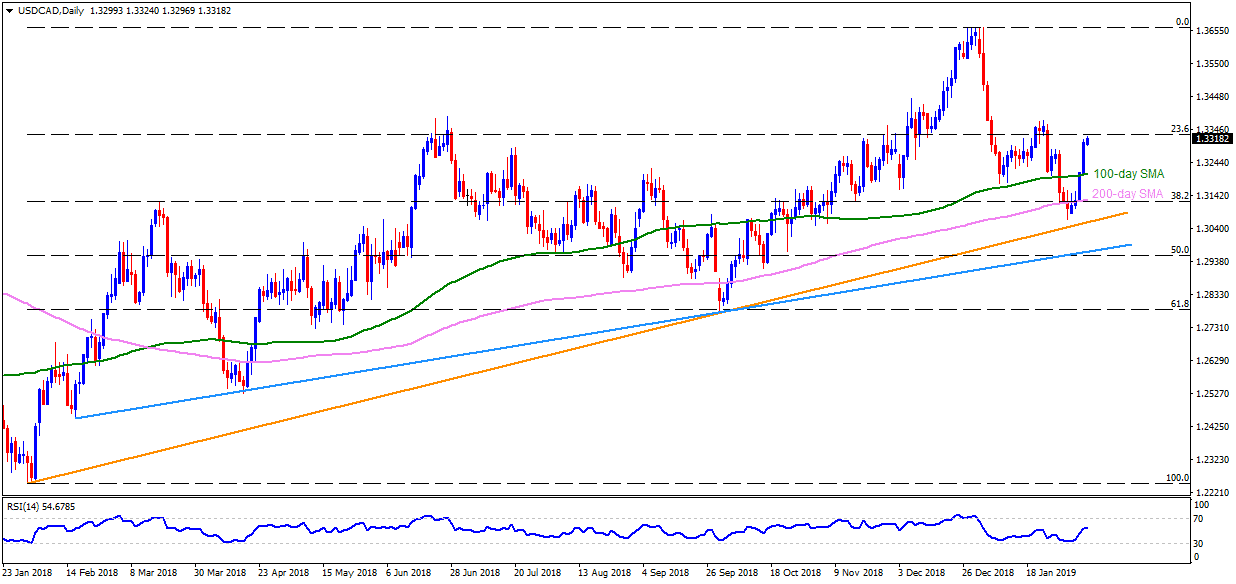
USD/CAD daily chart
- The Canadian Dollar trades positively around 1.3320 against the USD during early Asian session on Friday.
- Successful trading beyond 100-day & 200-day simple moving averages (SMAs) signal brighter chances of the pair’s further advances to January month high near 1.3370.
- During the pair’s additional rise past-1.3370, the 1.3440 and the 1.3565 become important resistances to watch before looking at the 1.3660-65 area including highs marked in December January period.
- On the downside, 100-day SMA level of 1.3200, followed by 1.3125 figure including 200-day SMA, can entertain sellers before challenging them with 1.3050 and the 1.2960 support-line figures.
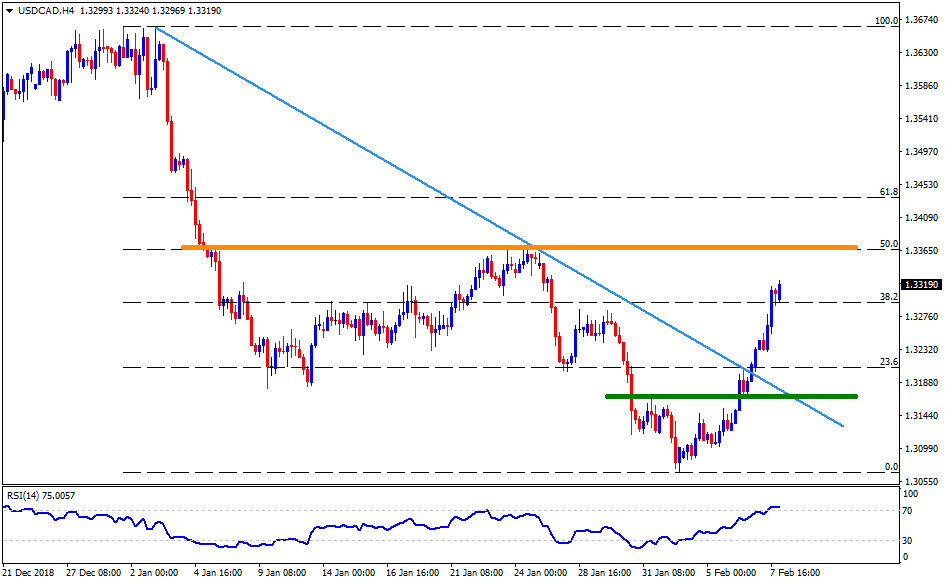
USD/CAD 4-hour chart
- In addition to the January month high on daily chart, 50% Fibonacci Retracement of December to February downturn also highlights the importance of 1.3365-70 resistance-region, clearing which can accelerate the upmoves to 1.3440, 1.3470 and 1.3490.
- Alternatively, the 1.3285 may act as adjacent support for the pair before dragging it to the 1.3200 and then to the 1.3170-65 support-zone.
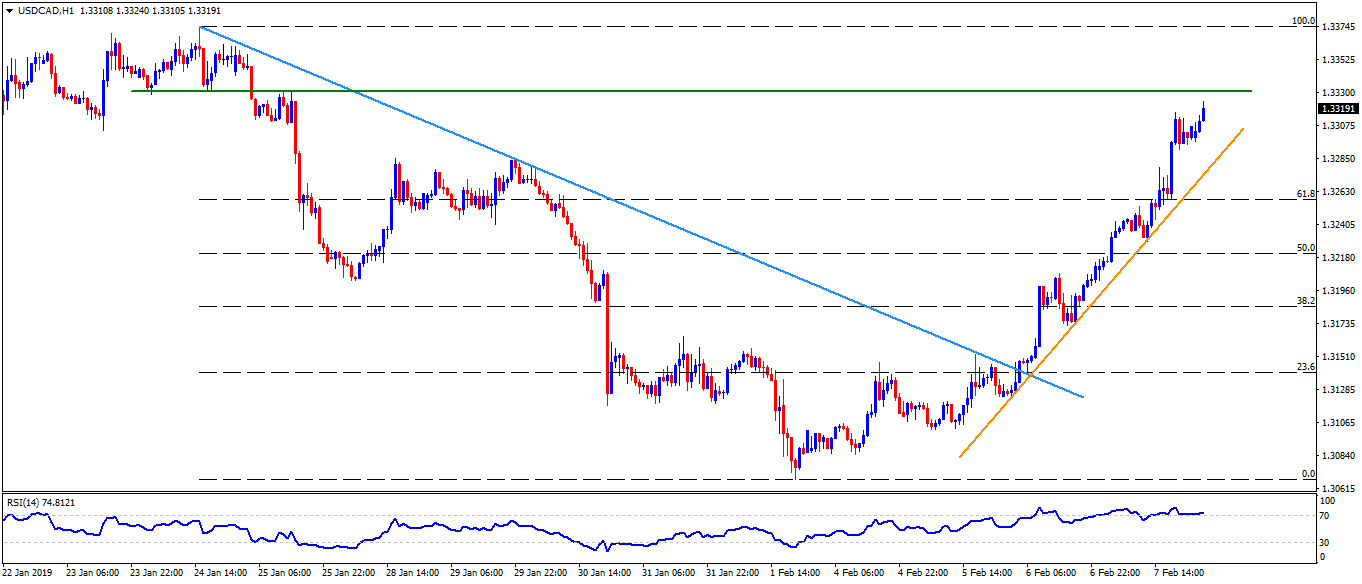
USD/CAD Hourly chart
- The hourly chart draws 1.3330 horizontal-line as an immediate resistance ahead of diverting market attention to the 1.3370.
- Meanwhile, an upward sloping trend-line, at 1.3270 now, is likely nearby support for the pair, a break of which can recall 1.3200 on the chart.