- USD/CAD trades below 61.8% Fibonacci retracement of July swing low to September swing high.
- A downward sloping trend-line since late-August could offer bounces during the quote’s south-run.
- An upside clearance of 1.3180 could trigger short-term recovery.
USD/CAD stays below near-term key resistance, 61.8% Fibonacci retracement level, as it trades near 1.3150 amid Asian session on Wednesday.
While sustained trading under strong upside barrier portrays the pair’s weakness, chances of its bounces off a falling trend-line since late-August lows, at 1.3125, can’t be denied.
As a result, buyers still have a hope to rise past-61.8% Fibonacci retracement level of 1.3156 while aiming to reach three-day long falling trend-line, at 1.3180. Though, a break of which could trigger pair fresh upside towards August 27 low near 1.3225.
In a case where prices slip below 1.3125 support-line, 1.3100 and July 18 bottom close to 1.3015 will flash on bears’ radar.
USD/CAD 4-hour chart
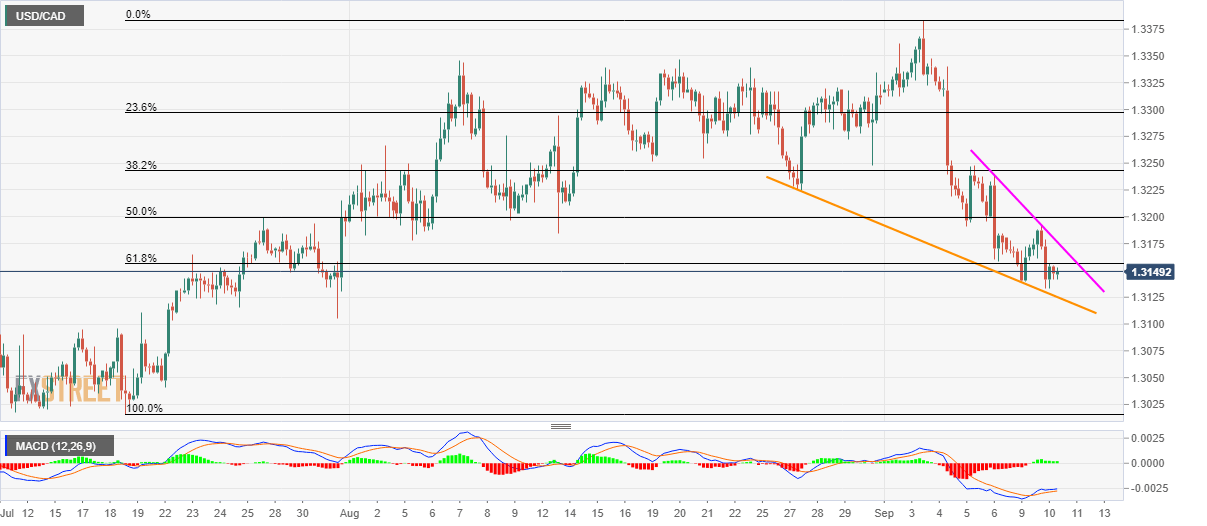
Trend: pullback expected
