- USD/CAD takes the bids to the monthly high.
- Overbought RSI conditions, nearness to key resistances could limit further upside.
- Two-week-old rising trend line acts as nearby key support.
Despite trading near the highest in nearly five weeks, USD/CAD is likely to find multiple resistances on the upside as it takes rounds to 1.3260 during Thursday’s pre-European session.
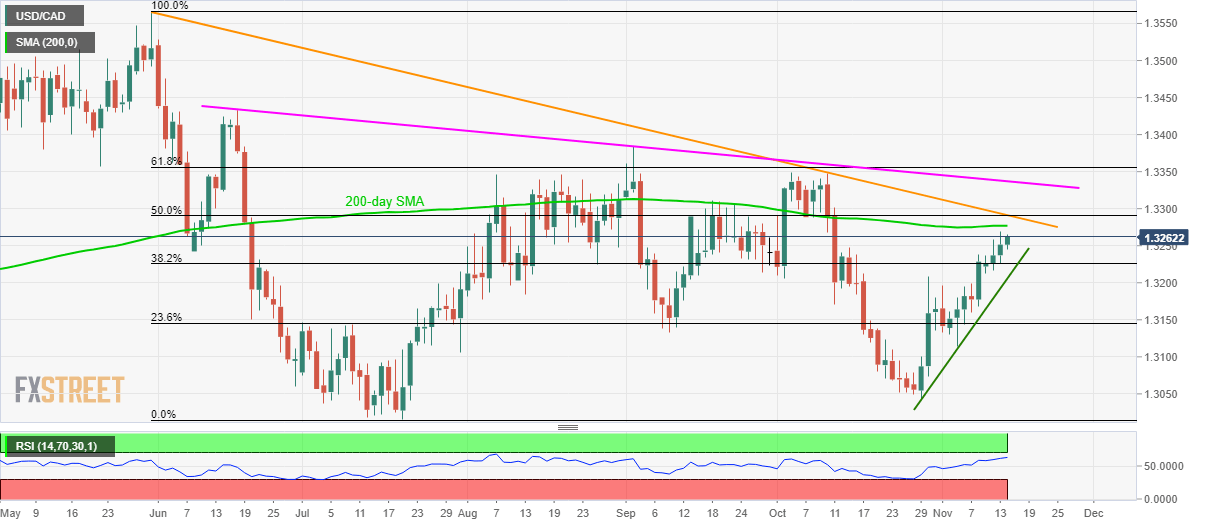
Among them, a 200-day Simple Moving Average (SMA) level of 1.3280 will be the first one to question buyers, failing to which can escalate the pair’s rise to 1.3290/95 confluence comprising 50% Fibonacci retracement of May-July declines and a downward sloping trend-line since May-end.
Should buyers ignore overbought conditions of 14-day Relative Strength Index (RSI) and dominate beyond 1.3300 round figures, another descending resistance line, from June 18, can question them near 1.3340.
Meanwhile, a two-week-old rising support line, at 1.3205, acts as immediate support that holds the key to pair’s fresh declines targeting 23.6% Fibonacci retracement level of 1.3145.
USD/CAD daily chart
Trend: Pullback expected
