- USD/CAD stays below near-term key support (now resistance).
- 200-day SMA adds resistance to the upside.
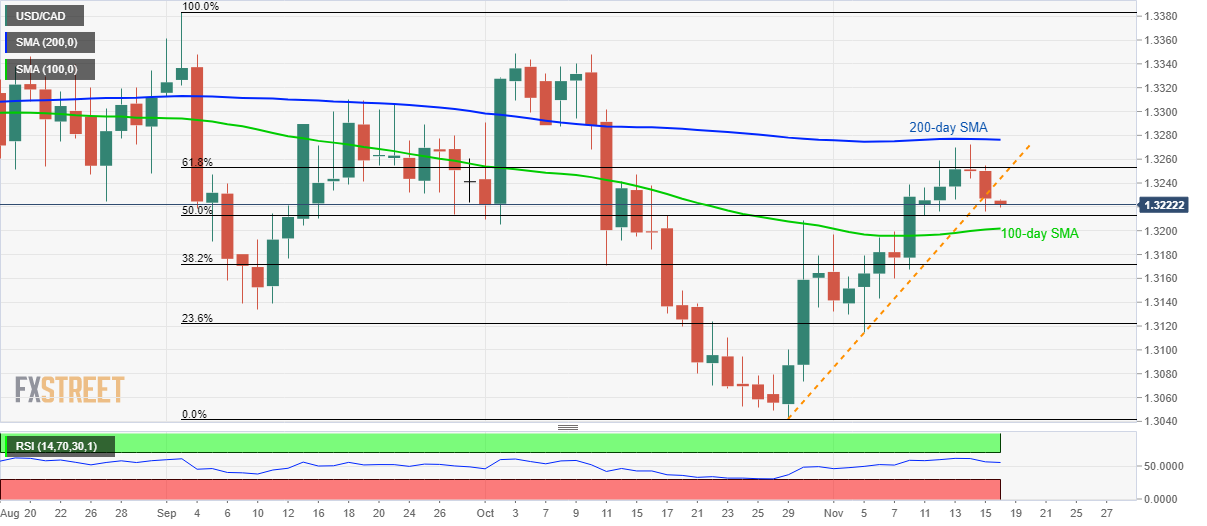
With its sustained trading below nearly three-week-old rising trend line, USD/CAD stays on the back foot while taking rounds to 1.3220 during Monday’s Asian session.
The pair nears 50% Fibonacci retracement level of September-October downside, at 1.3210, a break of which will shift sellers’ attention to 100-day Simple Moving Average (SMA), close to 1.3200.
Given the bears’ dominance past-1.3200, 38.2% Fibonacci retracement around 1.3170 and monthly bottom surrounding 1.3115 will return to the charts.
Meanwhile, pair’s pullback beyond support-turned-resistance, at 1.3245, needs to cross 61.8% Fibonacci retracement level of 1.3255 to confront 200-day SMA, at 1.3276.
Assuming the bull’s capacity to conquer 1.3276 on a daily closing basis, October month high near 1.3350 could become buyers’ favorites.
USD/CAD daily chart
Trend: Bearish
