- USD/CAD confronts 50% Fibonacci retracement during its recent recovery.
- A downward sloping resistance line since mid-June holds the key to 61.8% Fibonacci retracement.
- Multiple supports on the downside, bullish MACD question pair’s declines.
USD/CAD registers another U-turn from 10-day Simple Moving Average (SMA) while taking the bids to 1.3280 during the pre-European session on Wednesday.
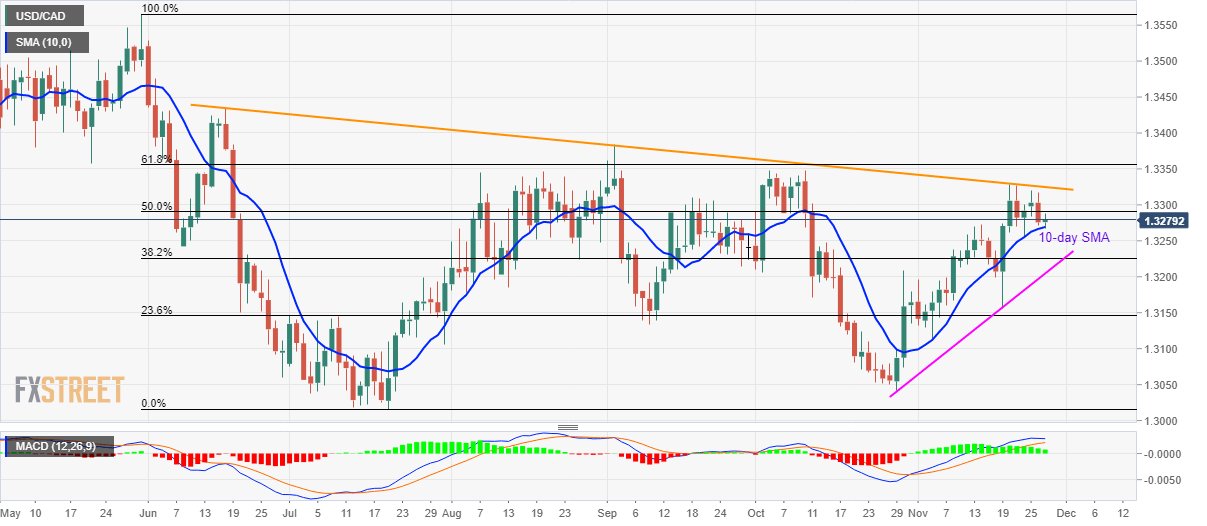
50% Fibonacci retracement of May-July fall, at 1.3291, acts as immediate resistance ahead of the key descending trend line ranging from June 18, near 1.3325/30.
In a case prices rally beyond 1.3330 on a daily closing basis, bulls may target 61.8% Fibonacci retracement around 1.3356/60 while heading towards September month top surrounding 1.3385.
Meanwhile, a downside break of the 10-day SMA level of 1.3270 can have 38.2% Fibonacci retracement level of 1.3225 and one-month-old rising trend line, at 1.3200, as near-term key supports.
Not only multiple supports but bullish signals from 12-bar Moving Average Convergence and Divergence (MACD) also portray the pair’s strength.
USD/CAD daily chart
Trend: Bullish
