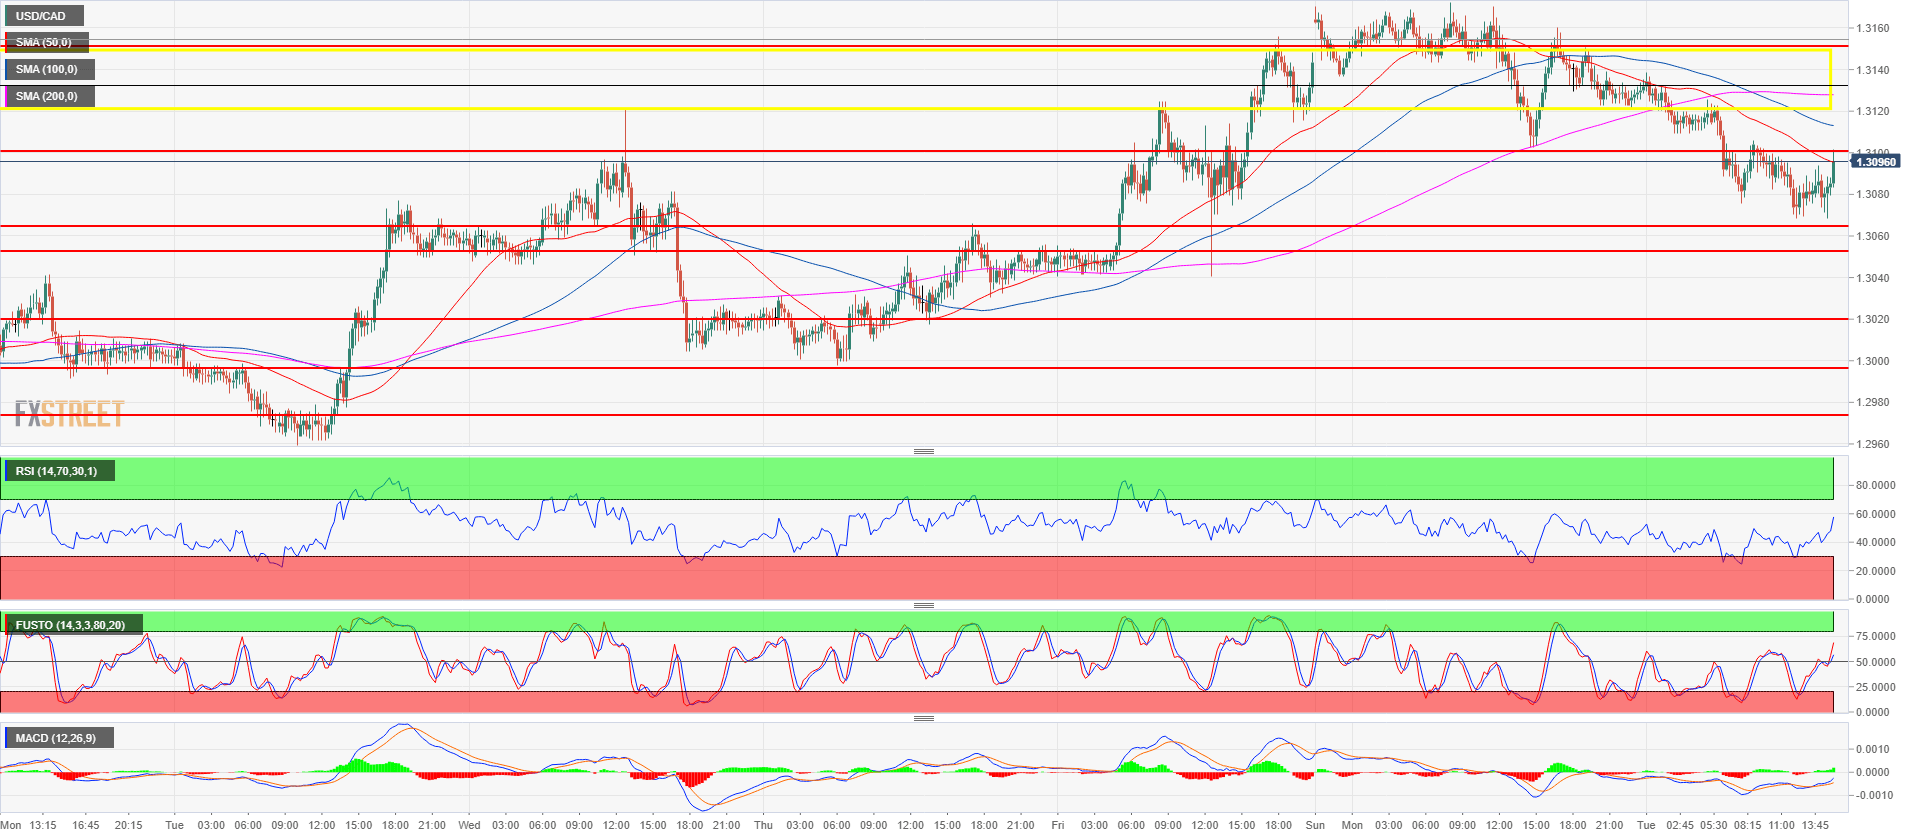
- USD/CAD is trading down for the second consecutive day as USD/CAD couldn’t sustain prices above the 1.3120-1.3155 zone and the daily bearish trendline. Bears are now keeping USD/CAD below the 1.3100 figure and the next scaling points to the downside are located near 1.3053-1.3066 area.
- Bulls need to recapture the 1.3120-1.3155 zone but the current short-term bearish momentum seems to prevail for now as the 50-period simple moving average crossed below the 200-period SMA on the 15-minute chart.
USD/CAD 15-minute chart
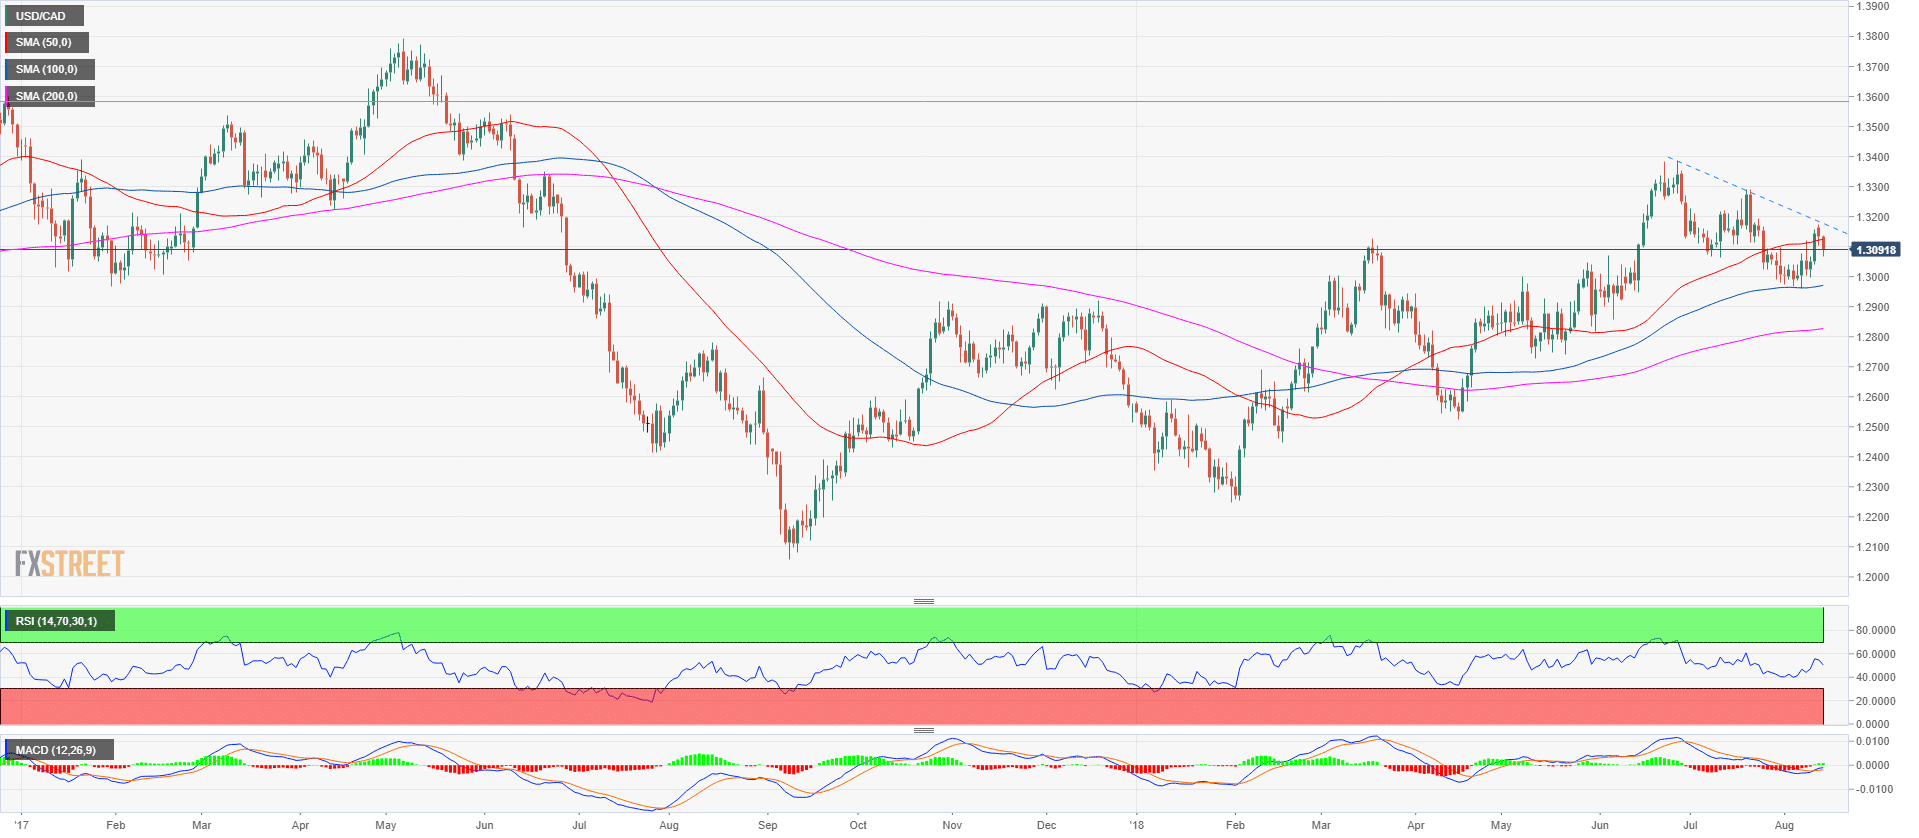
USD/CAD daily chart
Spot rate: 1.3094
Relative change: -0.30%
High: 1.3138
Low: 1.3068
Trend: Bullish
Short-term Trend: Bearish below 1.3120-1.3155 area
Resistance 1: 1.3100 figure
Resistance 2: 1.3120-1.3155 area, supply/demand level and June 18 low
Resistance 3: 1.3200 figure
Resistance 4: 1.3271 June 29 high
Resistance 5: 1.3350 figure
Resistance 6: 1.3388, 2018 high
Resistance 7: 1.3543 June 9, 2017 swing high
Support 1: 1.3053-1.3066 area, June 5 swing high and July 9 low
Support 2: 1.3022 July 25 low
Support 3: 1.3000 figure
Support 4: 1.2974 August 1 swing low
Support 5: 1.2900 figure
Support 6: 1.2855 June 6 low
