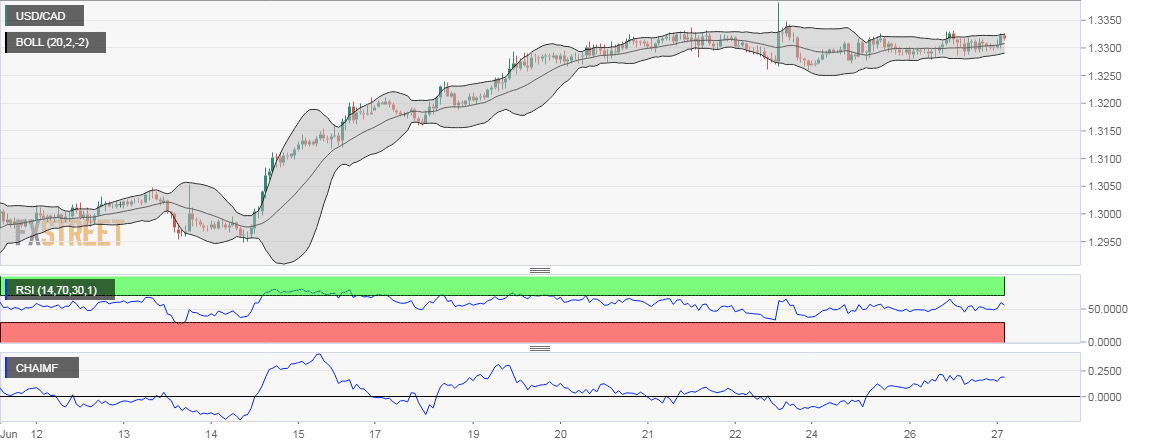
- USD/CAD hourly chart shows Bollinger Bands (+2/-2 standard deviation on 20-hour moving average) have narrowed (popularly known as squeeze), indicating low volatility.
- An extended period of low volatility is often followed by a big move (high volatility).
- The RSI is biased to the bulls (above 50.00), having built a base around 45.00 over the last two days. Also, Chaikin Money Flow is positive.
- So, Bollinger Band squeeze may end up with a bull breakout.
Hourly chart
Spot Rate: 1.3316
Daily High: 1.3324
Daily Low: 1.3294
Trend: Teasing a bull breakout
R1: 1.3229 (previous day’s high)
R2: 1.3385 (76.4% Fib R of Apr 2017 high – Sep 2017 low)
R3: 1.34 (psychological level)
Support
S1: 1.33 (round figure)
S2: 1.3260 (weekly low + 200-hour moving average)
S3: 1.3120 (4H 100-candle moving average)
