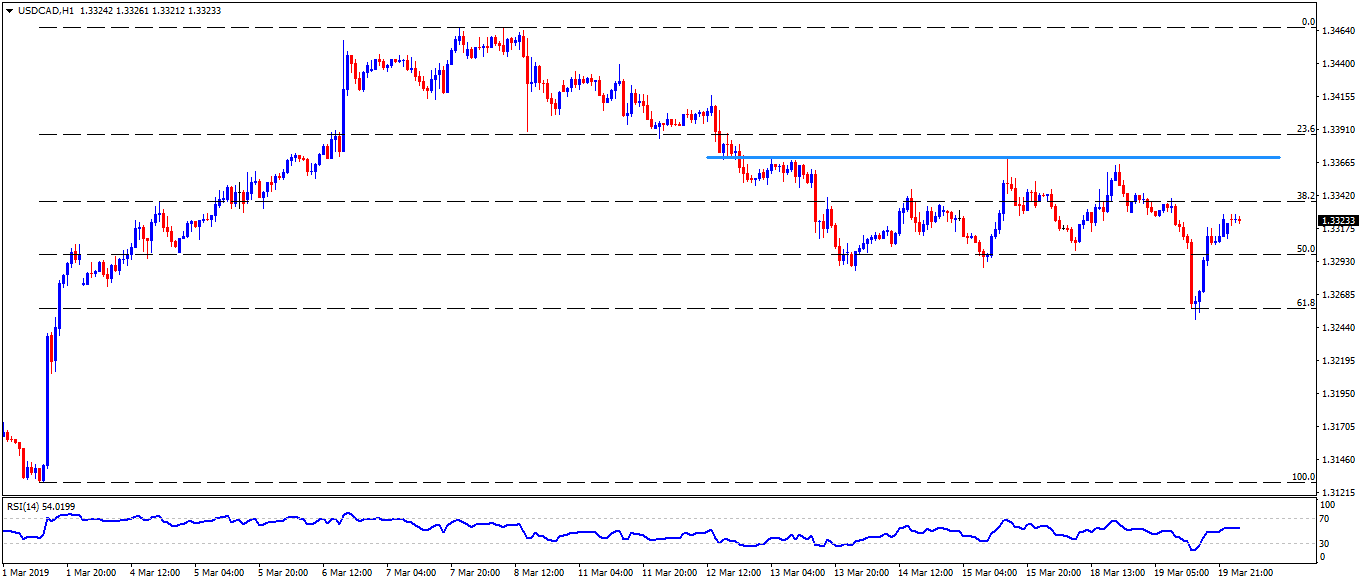
USD/CAD daily chart
- USD/CAD is little changed near 1.3330 on early Wednesday.
- The quote refrained from closing under 50-day simple moving average (SMA) on yesterday, which in turn highlights 1.3370/75 area comprising January high and multiple tops marked during a week’s time.
- Traders may focus on the US Federal Open Market Committee (FOMC) report, up for publishing at 18:00 GMT for fresh impulse.
- Should pair cross 1.3375 level, 1.3400 and a downward sloping trendline stretched since early January at 1.3430 become crucial for buyers to watch.
- Also, 1.3465 and 1.3500 are likely following resistances that may please bulls past-1.3430.
- On the downside break under 1.3265 SMA figure, pair can visit 50% Fibonacci retracement of October – December moves at 1.3220 ahead of testing 200-day SMA figure of 1.3180 and ascending trend-line support of 1.3170.
- In a case of pair’s decline beneath 1.3170, 61.8% Fibonacci near 1.3115 and February month low near 1.3065 might entertain sellers.
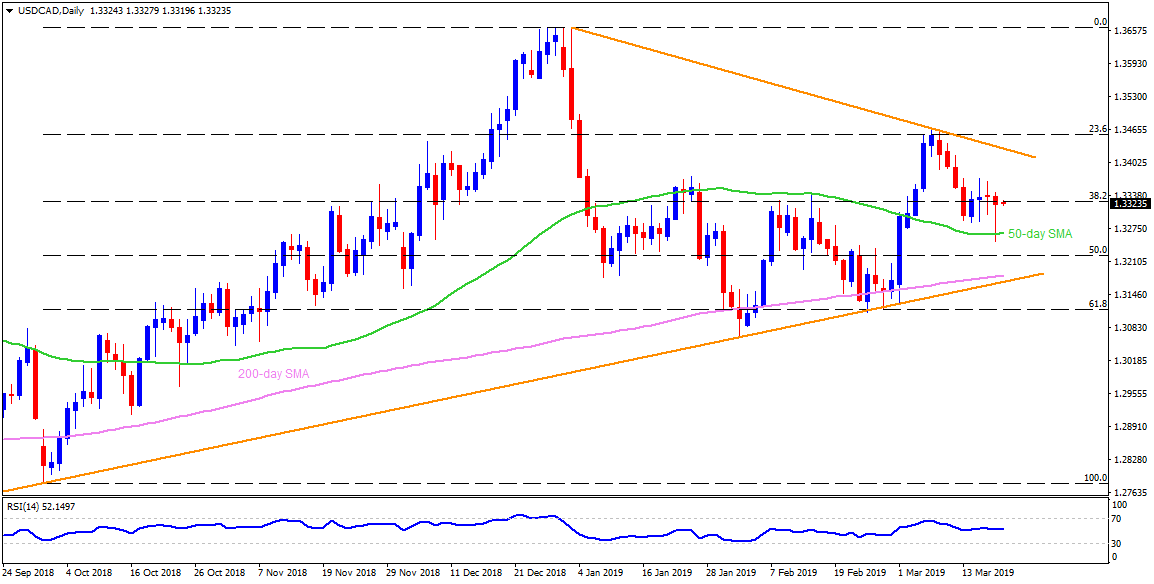
USD/CAD 4-Hour chart
- 1.3415 may offer an intermediate halt between 1.3430 and 1.3400 during the pair’s rise above 1.3375.
- 1.3240 should provide a buffer below 1.3265 to 1.3220.
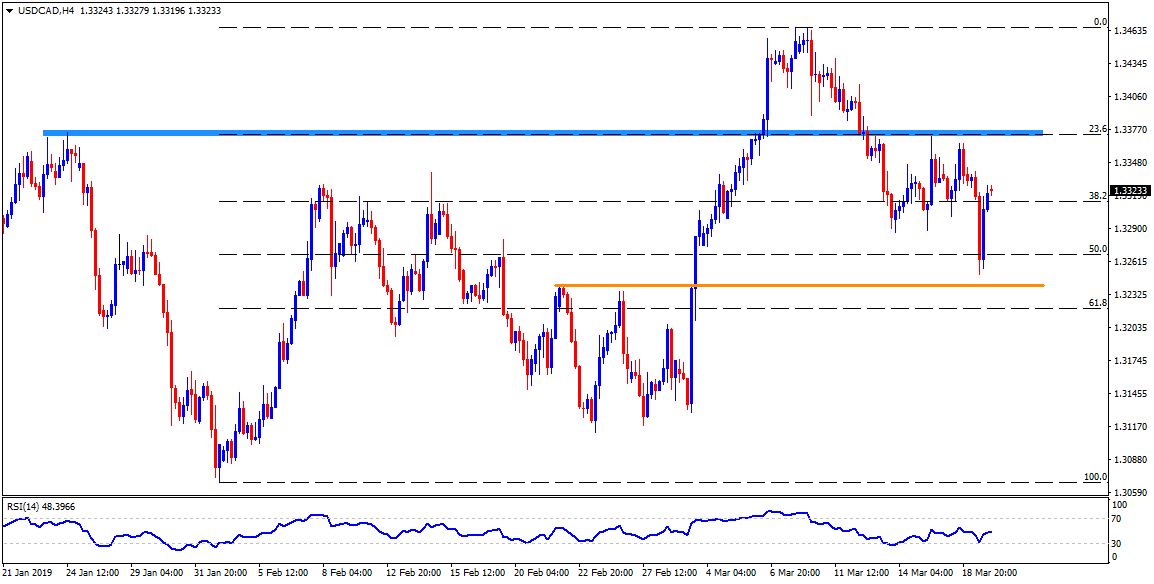
USD/CAD hourly chart
- 1.3210 and 1.3175 are likely minor supports contrasts to small resistances around 1.3390 and 1.3450.