- USD/CAD is bouncing as crude oil is down.
- The levels to beat for sellers are at 1.3200 and 1.3170 on the way down.
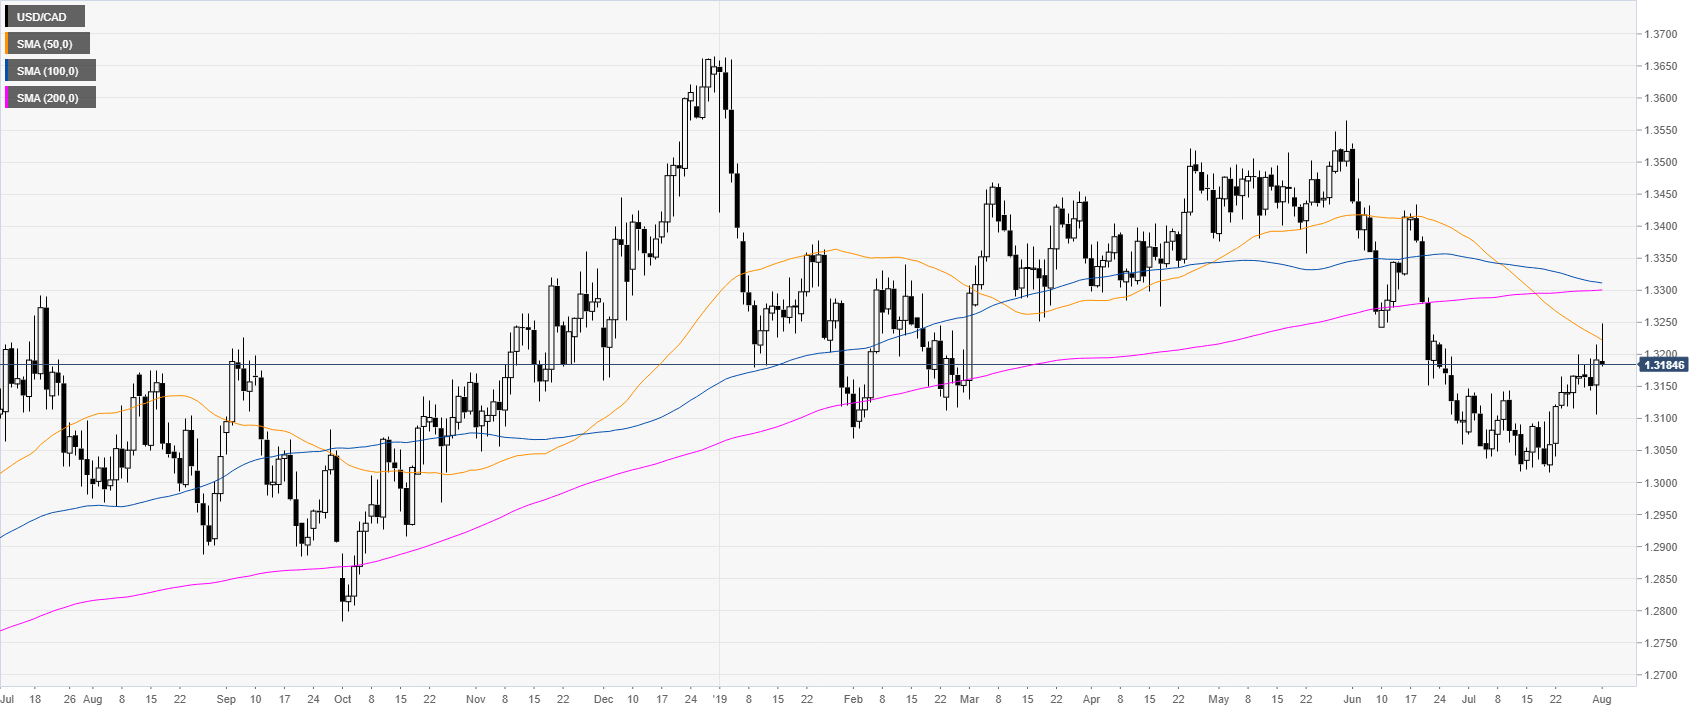
USD/CAD daily chart
USD/CAD is reversing its daily gains as the market finds resistance near 1.3250 and the 50-day simple moving averages (DSMA).
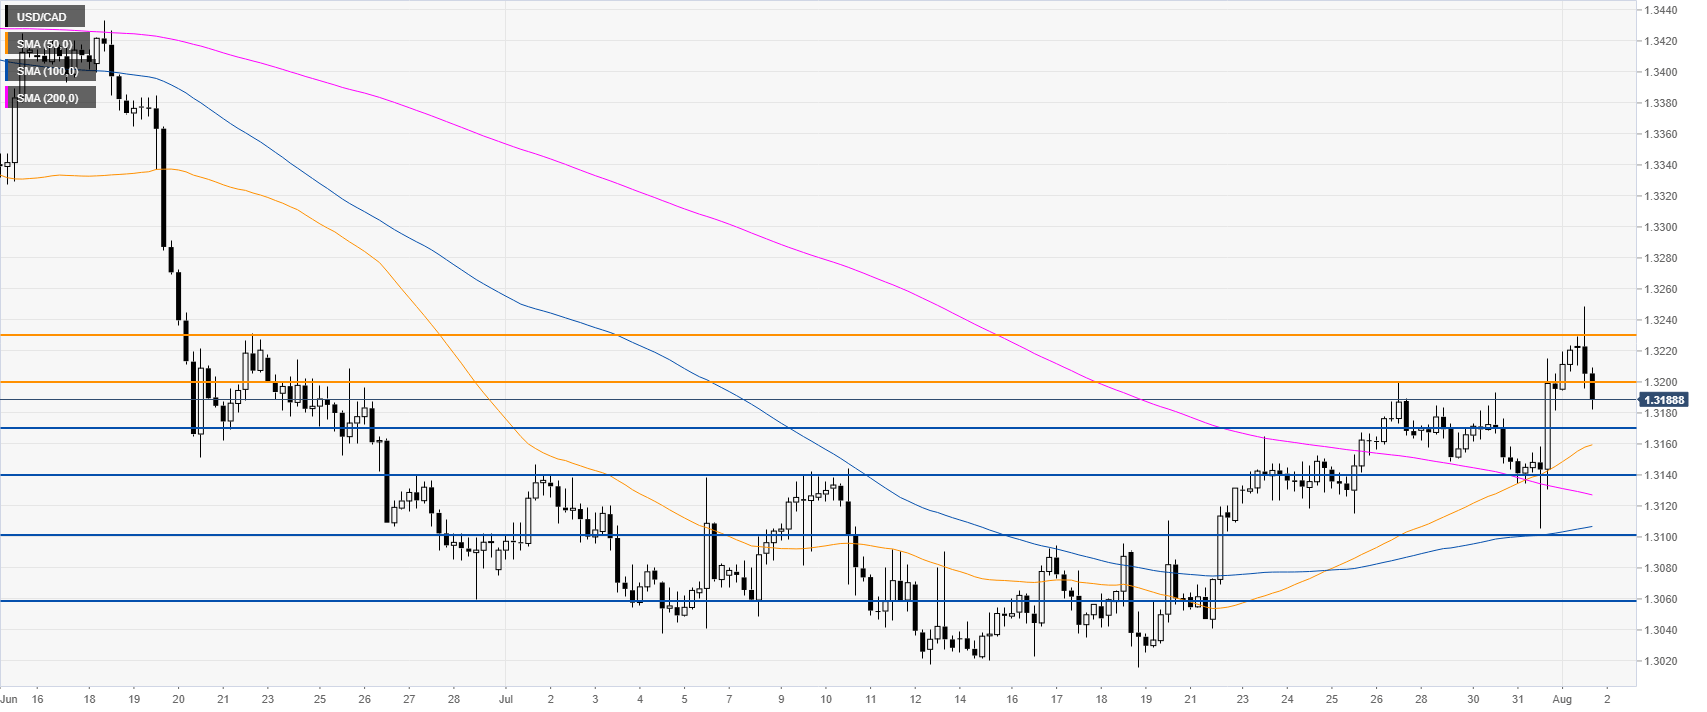
USD/CAD 4-hour chart
USD/CAD is trading above its main SMAs, suggesting bullish momentum in the near term. However, bulls would need a daily close above 1.3200 if they intend to reach 1.3230 resistance, according to the Technical Confluences Indicator.
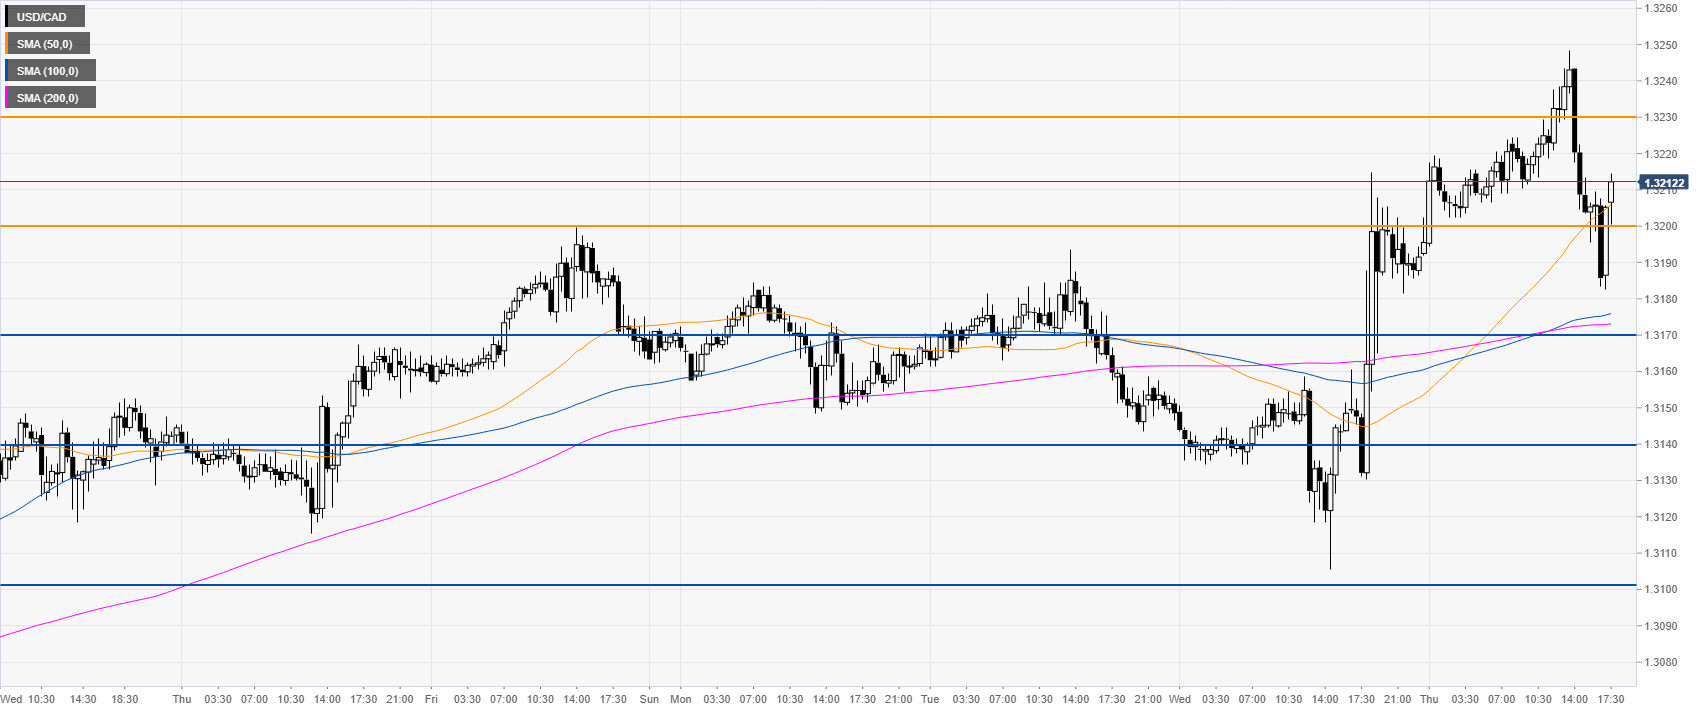
USD/CAD 30-minute chart
The pullback down can extend towards 1.3170, 1.3140 and 1.3100 , according to the Technical Confluences Indicator.
Additional key levels
