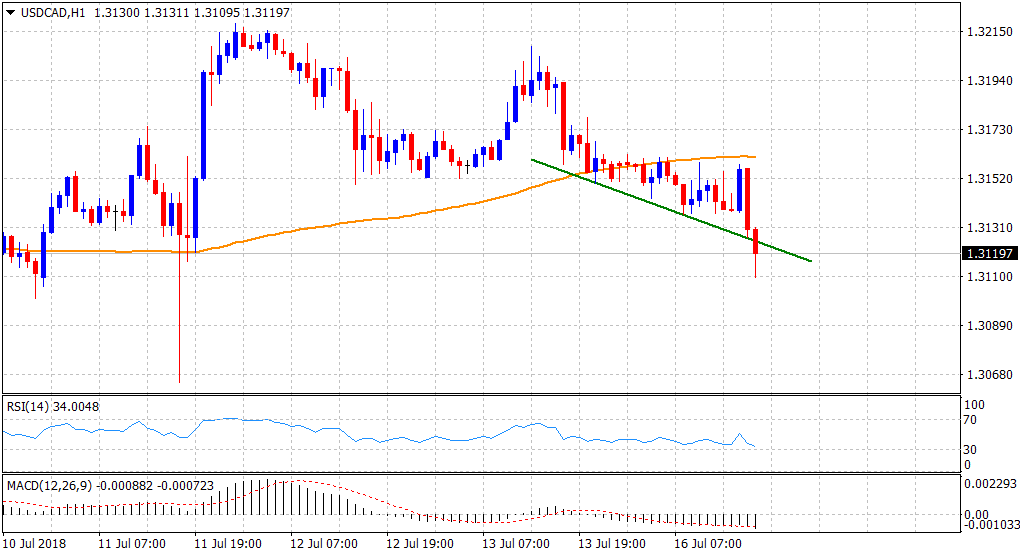
“¢ The US retail sales data-led uptick failed ahead of the 100-hour SMA, with bears dragging the pair below a short-term descending trend-line support on the 1-hourly chart.
“¢ Short-term technical indicators maintain bearish bias and hence, a follow-through weakness, back towards the post-BoC swing low, now looks a distinct possibility.
“¢ The ongoing slump in crude oil prices, which tends to undermine demand for the commodity-linked currency – Loonie, might turn out to be the only factor extending some support.
Spot rate: 1.3120
Daily High: 1.3163
Daily Low: 1.3110
Trend: Bearish
Support
S1: 1.3100 (round figure mark)
S2: 1.3072 (S3 daily pivot-point)
S3: 1.3032 (50-day SMA)
Resistance
R1: 1.3161 (100-period SMA H1)
R2: 13209 (Friday’s swing high)
R3: 1.3270 (horizontal zone)
