“¢ The pair continued with its struggled to breakthrough 1.3280 resistance zone, marking 61.8% Fibonacci expansion level of the 1.3064-1.3234 up-move and subsequent retracement.
“¢ Meanwhile, short-term technical indicators still hold in positive territory and hence, dip-buying interest might continue to keep a floor on any meaningful retracement from three-week tops.
“¢ However, it would be prudent to wait for a follow-through momentum beyond 61.8% Fibonacci expansion level before positioning for any further up-move, even beyond the 1.3300 handle.
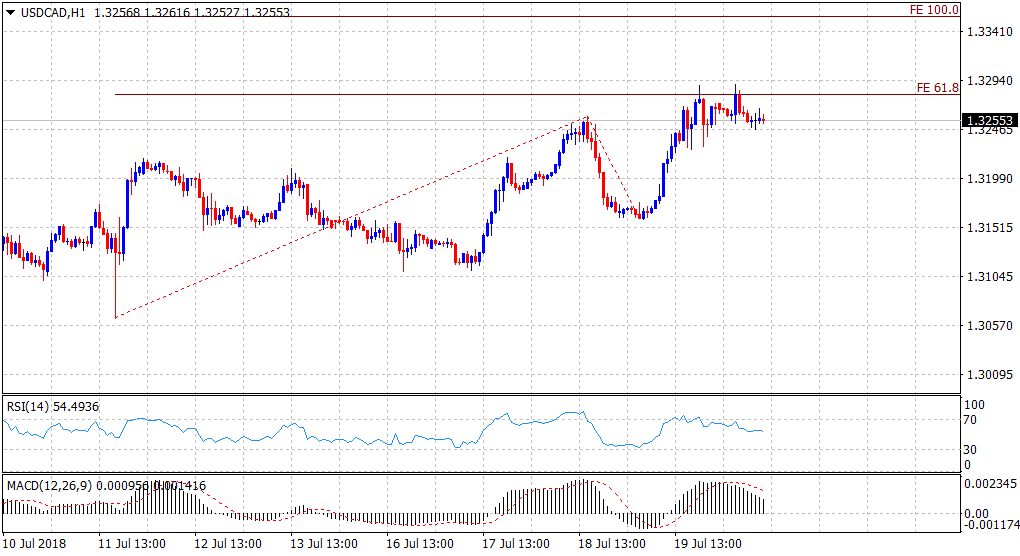
Spot rate: 1.3255
Daily High: 1.3290
Daily Low: 1.3246
Trend: Bullish
Resistance
R1: 1.3300 (round figure mark)
R2: 1.3355 (100% Fibo. expansion level)
R3: 1.3386 (1-year top set on June 27)
Support
S1: 1.3226 (50-period SMA H1)
S2: 1.3190 (S1 daily pivot-point)
S3: 1.3160 (overnight swing low)
