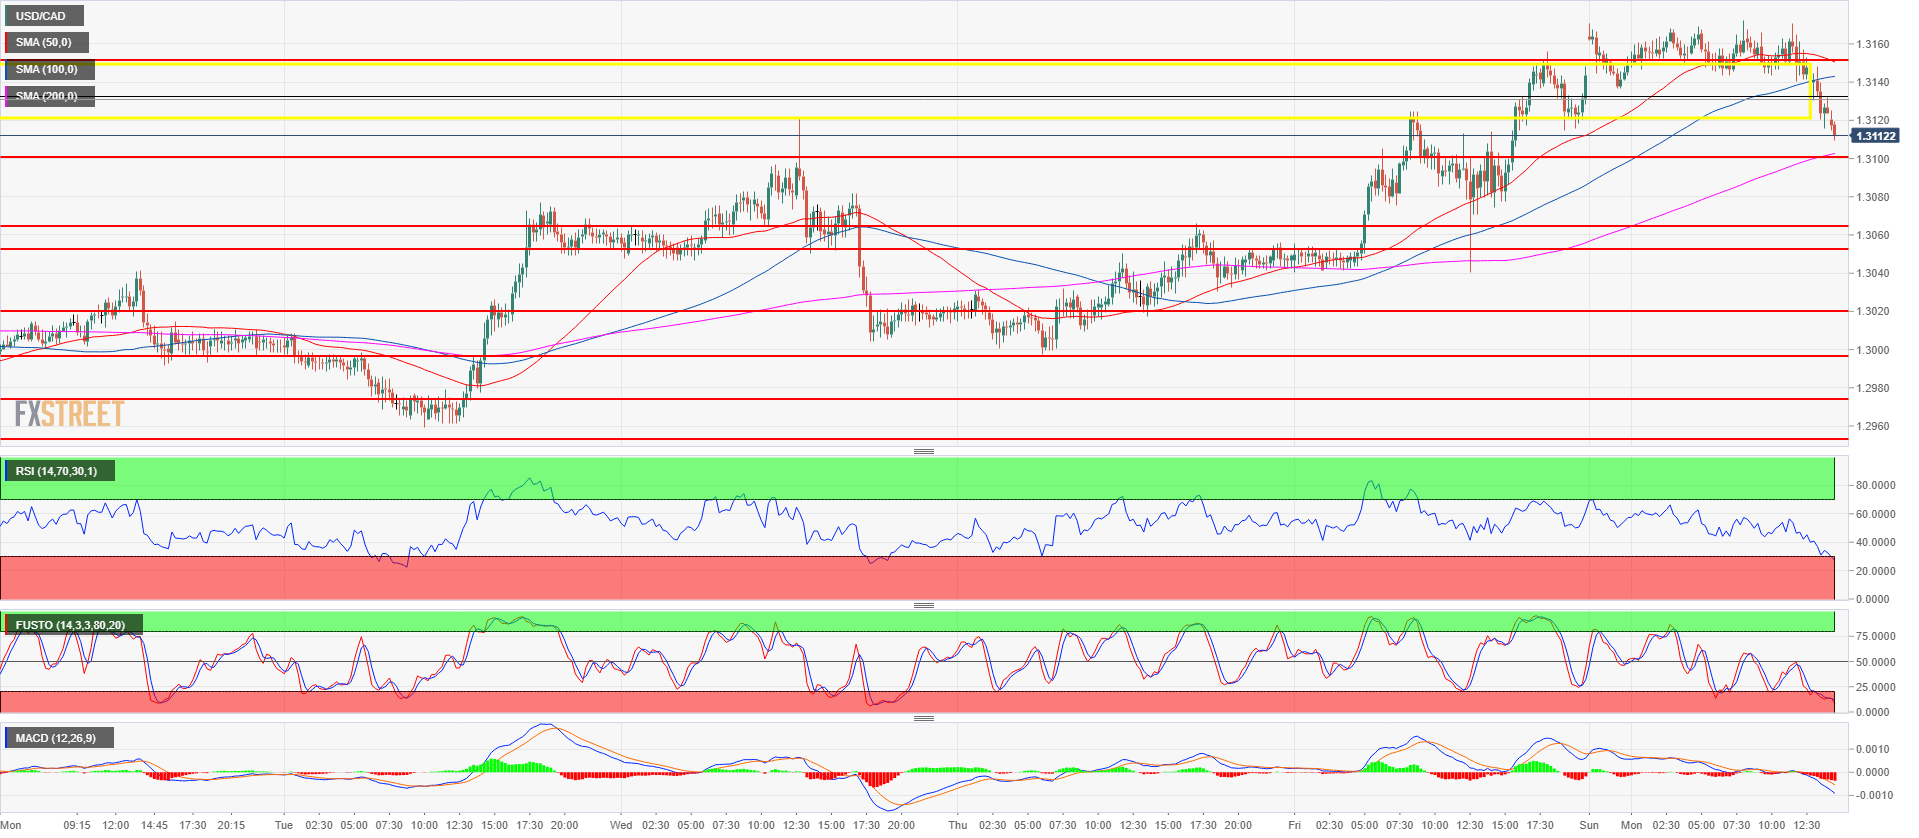
- USD/CAD is starting the week on the back foot as the currency pair is correcting below the 1.3120-1.3155 key supply/demand level.
- Bulls would need to quickly trade above the 1.3155 level if they don’t want to see the market make a rotation lower towards 1.3053-1.3066 area.
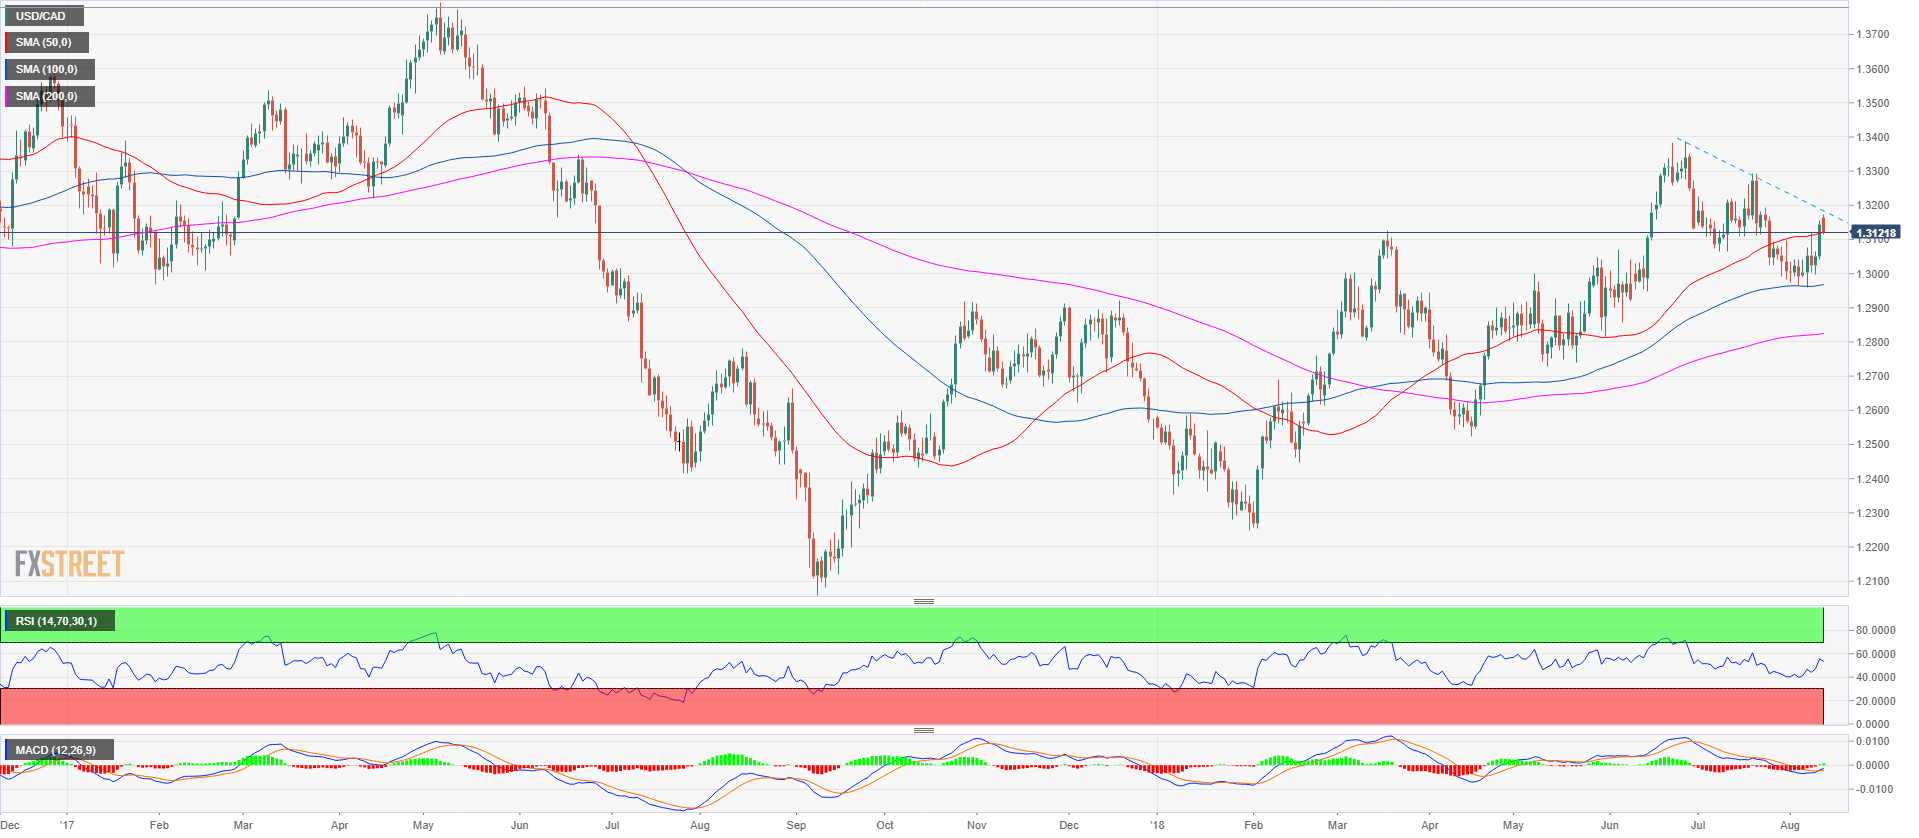
- USD/CAD is also having a hard time to break above the bearish trendline on the daily chart suggesting short-term bearish momentum.
USD/CAD 15-minute chart
USD/CAD daily chart
Spot rate: 1.3111
Relative change: -0.24%
High: 1.3172
Low: 1.3107
Trend: Bullish
Resistance 1: 1.3120-1.3155 supply/demand level and June 18 low
Resistance 2: 1.3200 figure
Resistance 3: 1.3271 June 29 high
Resistance 4: 1.3350 figure
Resistance 5: 1.3388, 2018 high
Resistance 6: 1.3543 June 9, 2017 swing high
Support 1: 1.3100 figure
Support 2: 1.3053-1.3066 area, June 5 swing high and July 9 low
Support 3: 1.3022 July 25 low
Support 4: 1.3000 figure
Support 5: 1.2974 August 1 swing low
Support 6: 1.2900 figure
Support 7: 1.2855 June 6 low
