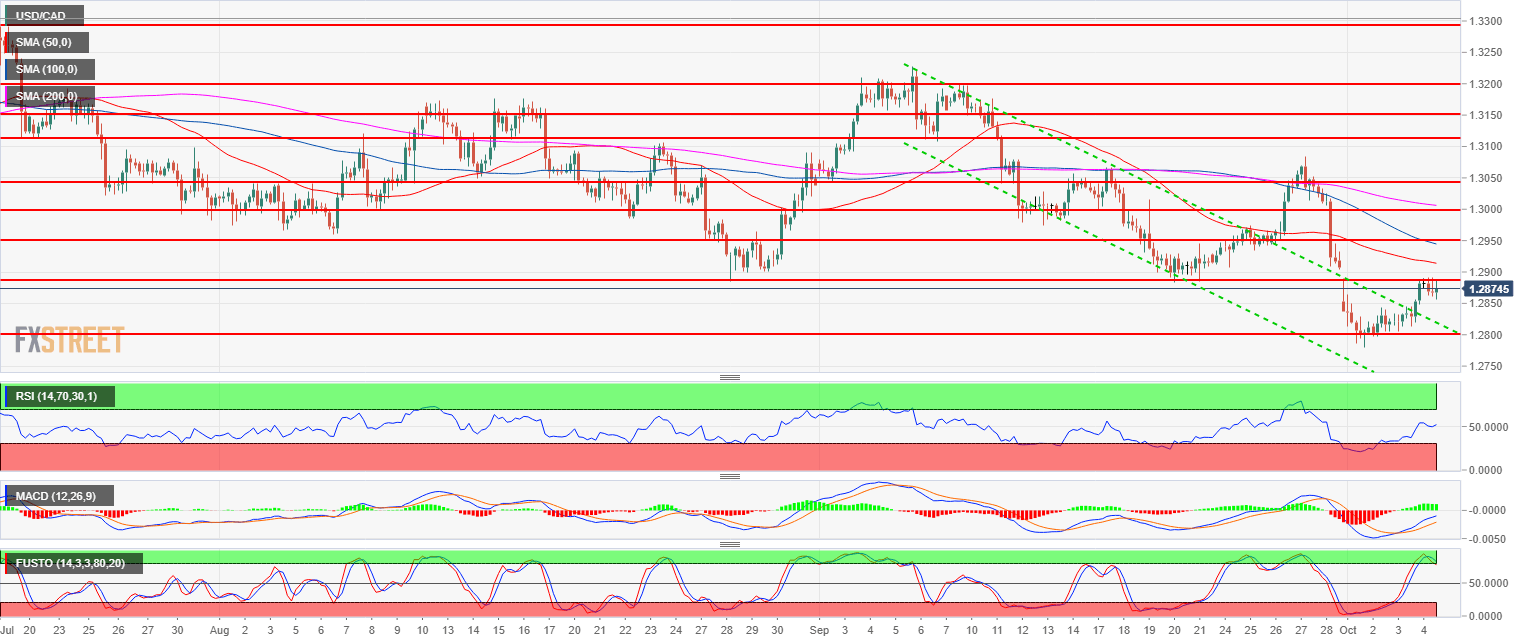
- USD/CAD is finding resistance just below the 1.2900 figure multi-week resistance.
- USD/CAD is trading below its 50, 100 and 200-period simple moving averages suggesting a bearish bias. However, the RSI, MACD and Stochastics indicators keep a bullish momentum for the time being.
- If capped below 1.2900 figure USD/CAD has room to potentially drop to 1.2800 figure.
USD/CAD
Overview:
Last Price: 1.2876
Daily change: 6.0 pips
Daily change: 0.0466%
Daily Open: 1.287
Trends:
Daily SMA20: 1.2988
Daily SMA50: 1.3022
Daily SMA100: 1.3051
Daily SMA200: 1.2867
Levels:
Daily High: 1.2886
Daily Low: 1.2806
Weekly High: 1.3083
Weekly Low: 1.2904
Monthly High: 1.3228
Monthly Low: 1.2882
Daily Fibonacci 38.2%: 1.2855
Daily Fibonacci 61.8%: 1.2836
Daily Pivot Point S1: 1.2822
Daily Pivot Point S2: 1.2774
Daily Pivot Point S3: 1.2742
Daily Pivot Point R1: 1.2902
Daily Pivot Point R2: 1.2934
Daily Pivot Point R3: 1.2982
Main trend: Neutral to bearish
Resistances and Supports:
Resistance 1: 1.2882-1.2900 September 20 low and figure
Resistance 2: 1.2959 August 7 low
Resistance 3: 1.3000 figure
Resistance 4: 1.3048 August 14 low
Resistance 5: 1.3108, September 7 low
Resistance 6: 13200 figure
Support 1: 1.2855-65 June 6 low – 200-day SMA
Support 2: 1.2800 figure
Support 3: 1.2727 May 11 low
Support 4: 1.2600 figure
