- USD/CAD seesaws near 50% Fibonacci retracement after failing to rise past-200-DMA.
- 21-DMA offers immediate support.
- Momentum indicators show normal conditions favoring the continuation of range-bound trading.
USD/CAD makes the rounds to 50% Fibonacci retracement as it trades near 1.3215 during early Wednesday.
The pair has been trading between the 21 and 200 day moving averages (DMA) since the month-start with the latest U-turn from 200-DMA indicating brighter chances of its pullback to 21-DMA level of 1.3177.
Momentum indicators like 14-bar relative strength index (RSI) and 12-day moving average convergence and divergence indicate normal conditions and continuation of the pair’s trading range.
If sellers refrain from respecting 1.3177 rest-point, 61.8% Fibonacci retracement of October to December 2018 upside, at 1.3120, and July month low near 1.3016 could be on their watch list.
Alternatively, pair’s rise past-1.3306 level comprising 200-DMA can take aim at early-May month low surrounding 1.3380.
USD/CAD daily chart
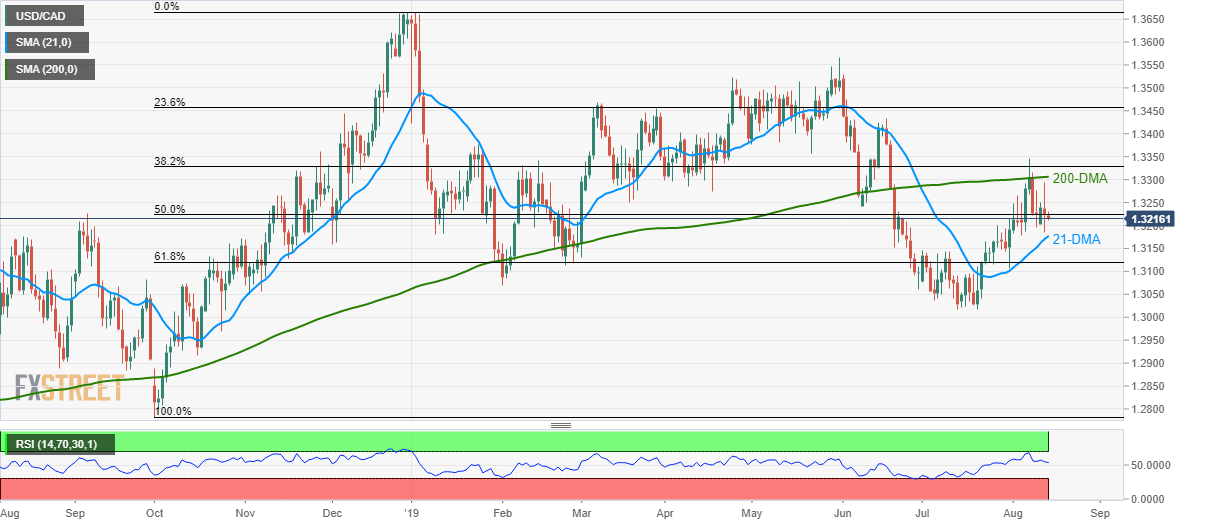
Trend: Sideways
