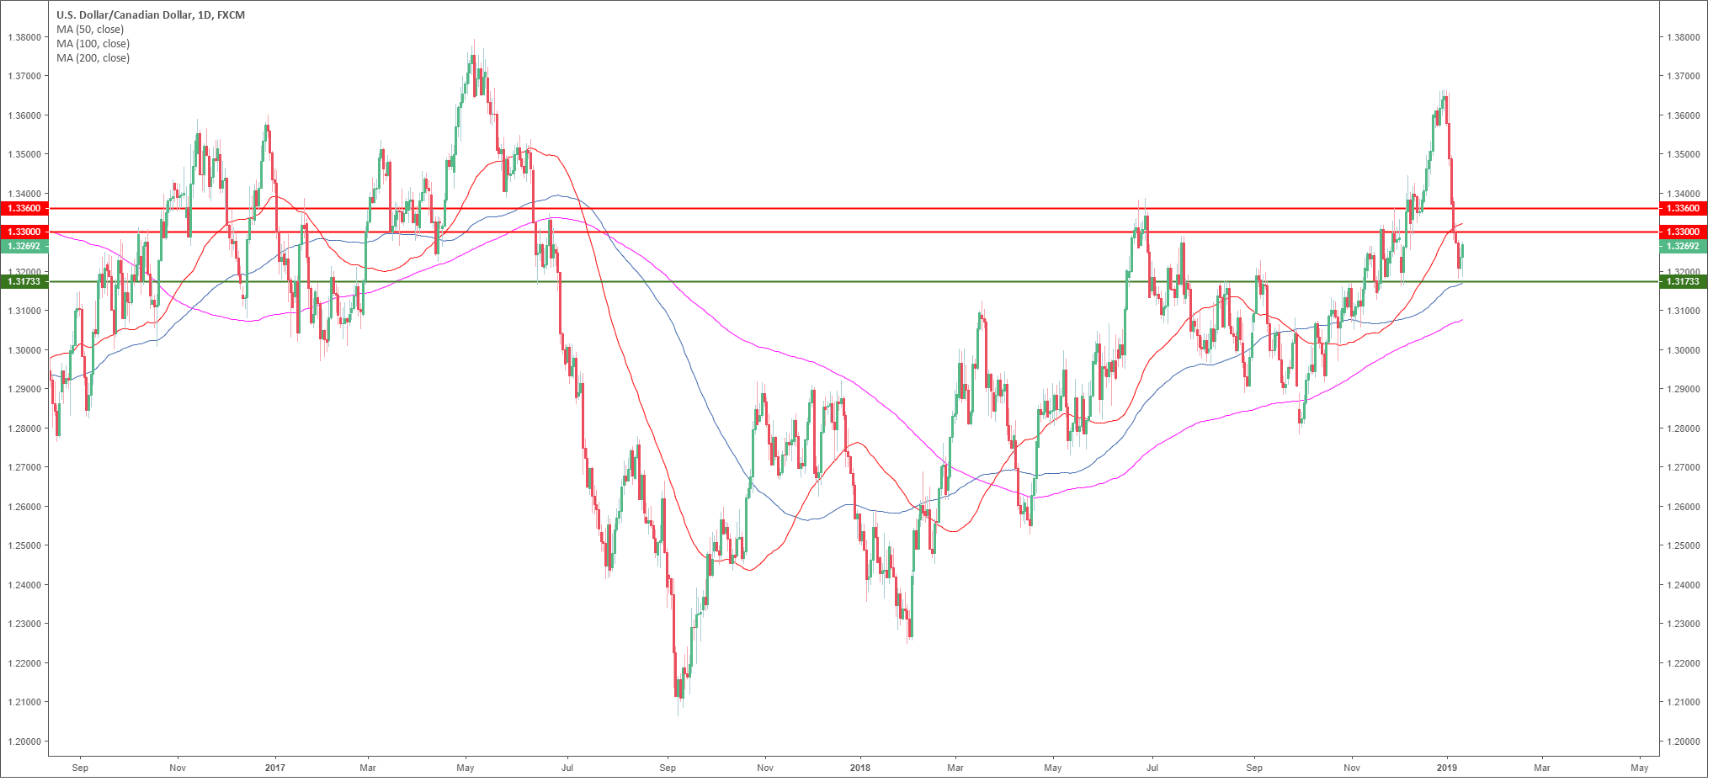
USD/CAD daily chart
- USD/CAD is trading in a bull trend above the 200 SMA.
- USD/CAD is consolidating the recent losses above 1.3200 and the 100 SMA.
- Earlier this Friday, the US CPI (Consumer Producer Index) matched analysts expectations at 2.2% for December y/y.
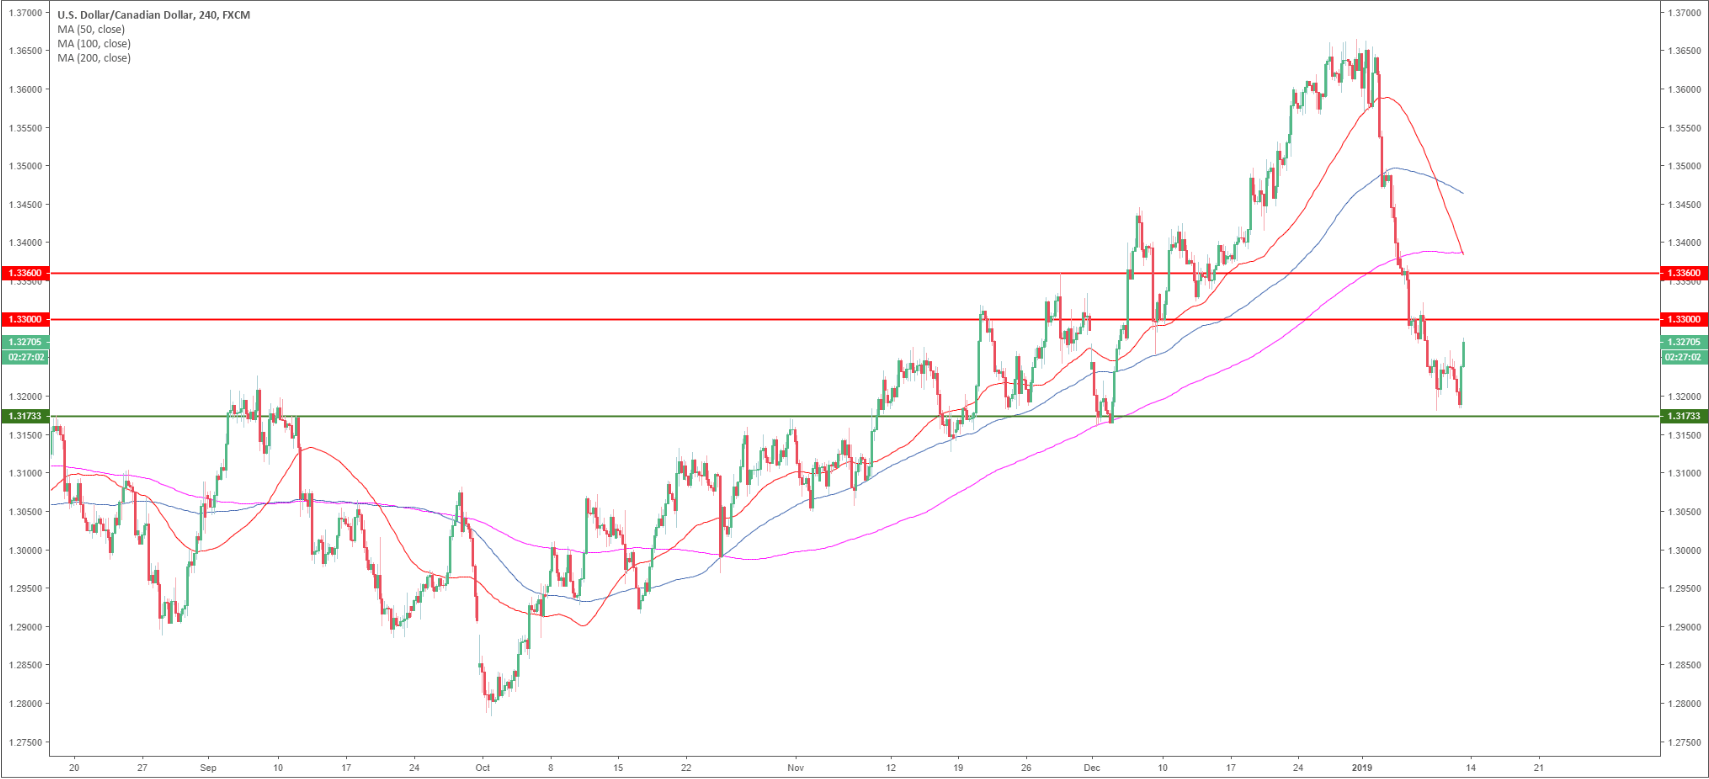
USD/CAD 4-hour chart
- USD/CAD is trading below its main SMAs.
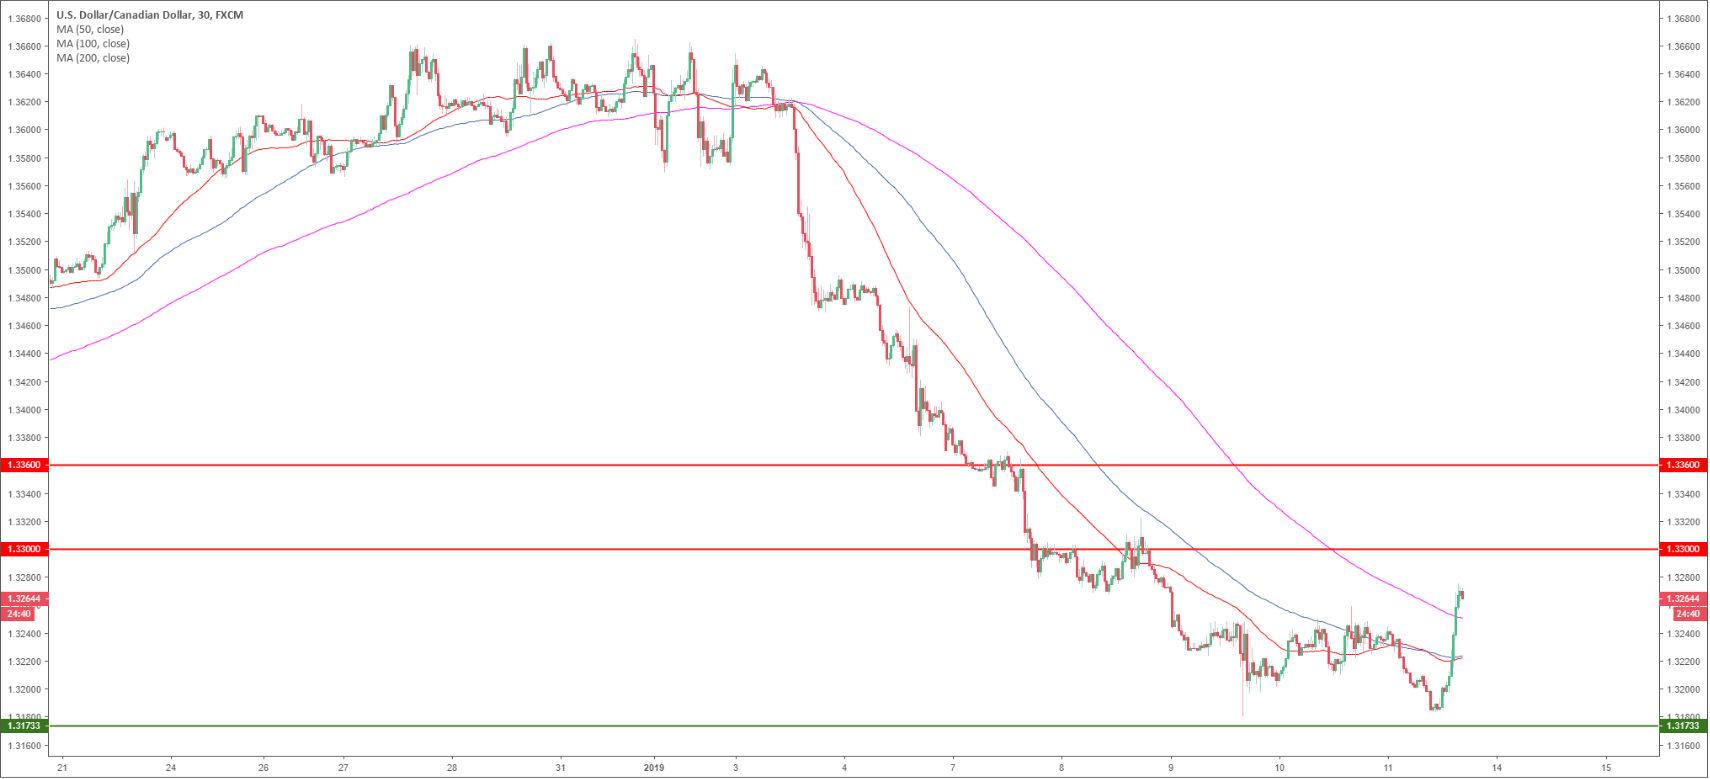
USD/CAD 30-minute chart
- USD/CAD bulls are gaining ground as they reclaimed the main SMAs. They are now most likely en route to the 1.3300 figure and 1.3360 level if they gather enough steam.
Additional key levels
USD/CAD
Overview:
Today Last Price: 1.327
Today Daily change: 33 pips
Today Daily change %: 0.249%
Today Daily Open: 1.3237
Trends:
Previous Daily SMA20: 1.3509
Previous Daily SMA50: 1.3353
Previous Daily SMA100: 1.3185
Previous Daily SMA200: 1.3084
Levels:
Previous Daily High: 1.326
Previous Daily Low: 1.3202
Previous Weekly High: 1.3666
Previous Weekly Low: 1.338
Previous Monthly High: 1.4134
Previous Monthly Low: 1.316
Previous Daily Fibonacci 38.2%: 1.3238
Previous Daily Fibonacci 61.8%: 1.3224
Previous Daily Pivot Point S1: 1.3205
Previous Daily Pivot Point S2: 1.3174
Previous Daily Pivot Point S3: 1.3146
Previous Daily Pivot Point R1: 1.3264
Previous Daily Pivot Point R2: 1.3292
Previous Daily Pivot Point R3: 1.3323
