- The Greenback loses steam again against the Canadian Dollar as the spot market is trading near 1.5-month lows.
- The level to beat for bears is the 1.3120 support level.
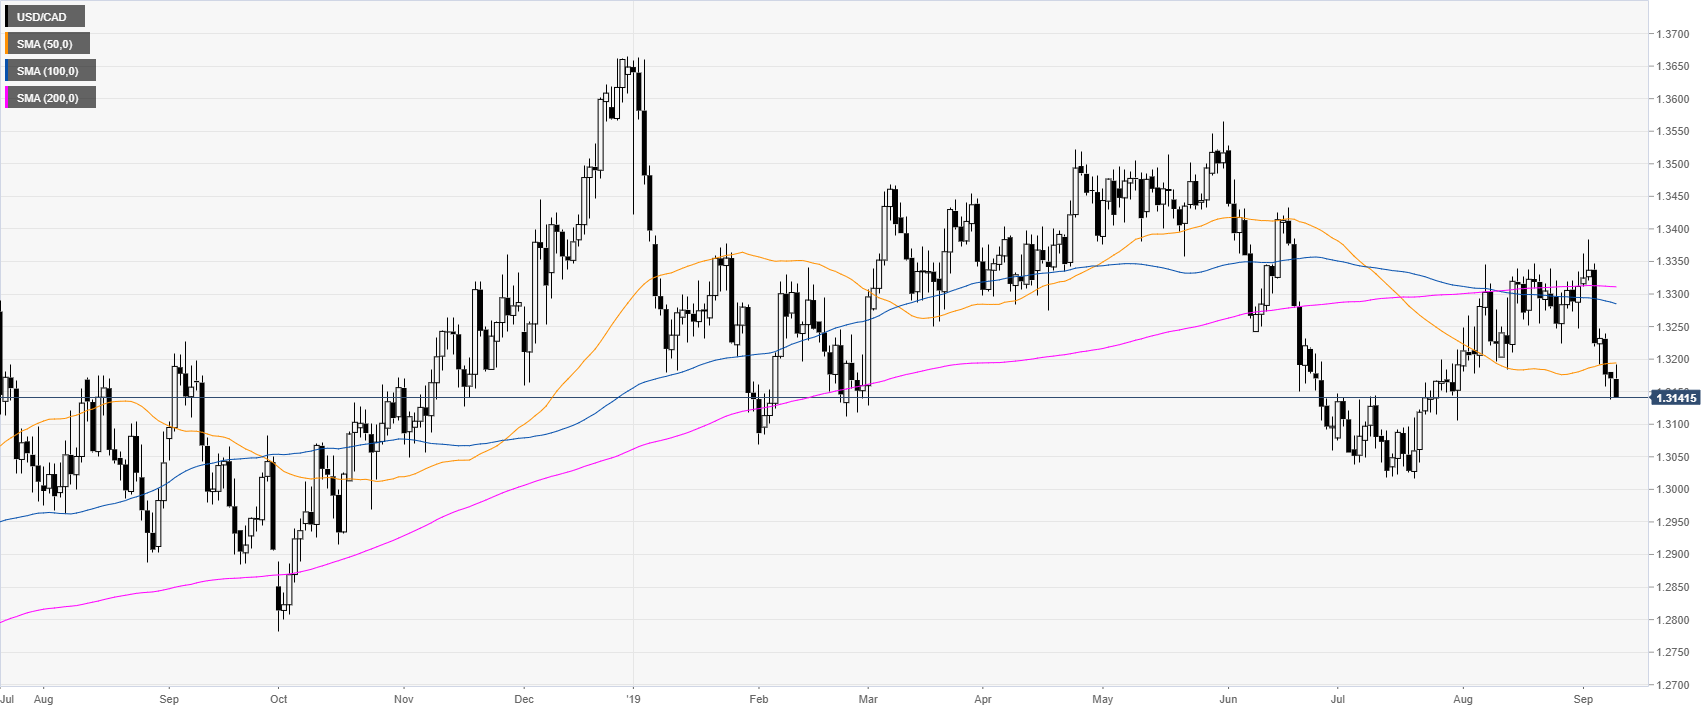
USD/CAD daily chart
USD/CAD is trading in a bear trend below its main simple moving averages (SMAs).
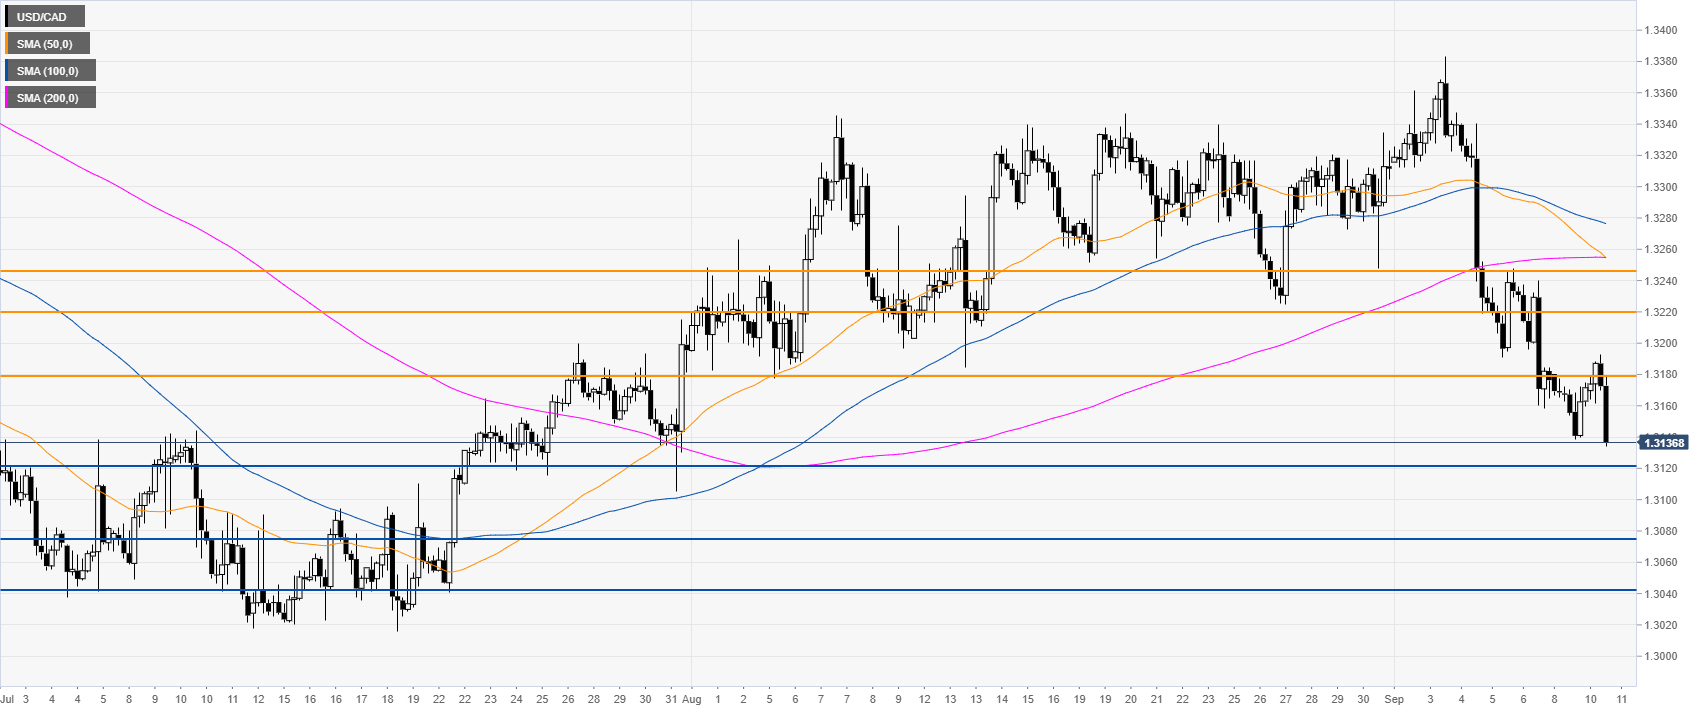
USD/CAD 4-hour chart
USD/CAD is trading below its main SMAs, suggesting bearish momentum in the medium term. The market is trading at its lowest in two months. Sellers want to reach 1.3112, 1.3075 and 1.3043 on the way down, according to the Technical Confluences Indicator.
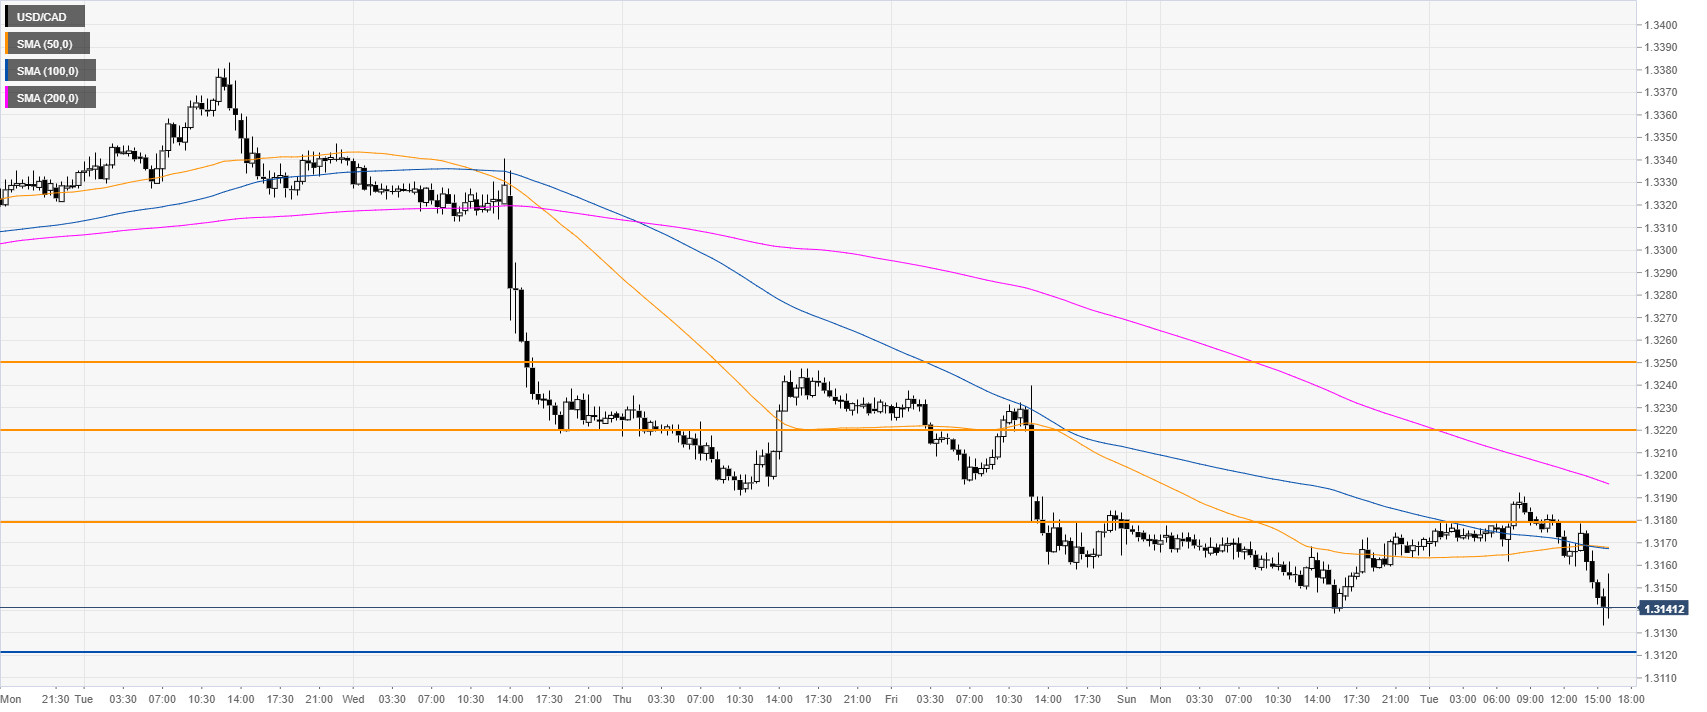
USD/CAD 30-minute chart
USD/CAD takes another hit as the market is under bearish pressure below the main SMAs. Bulls will need to regain 1.3180 to attract buying interest towards 1.3220 and 1.3250 resistance levels.
Additional key levels
