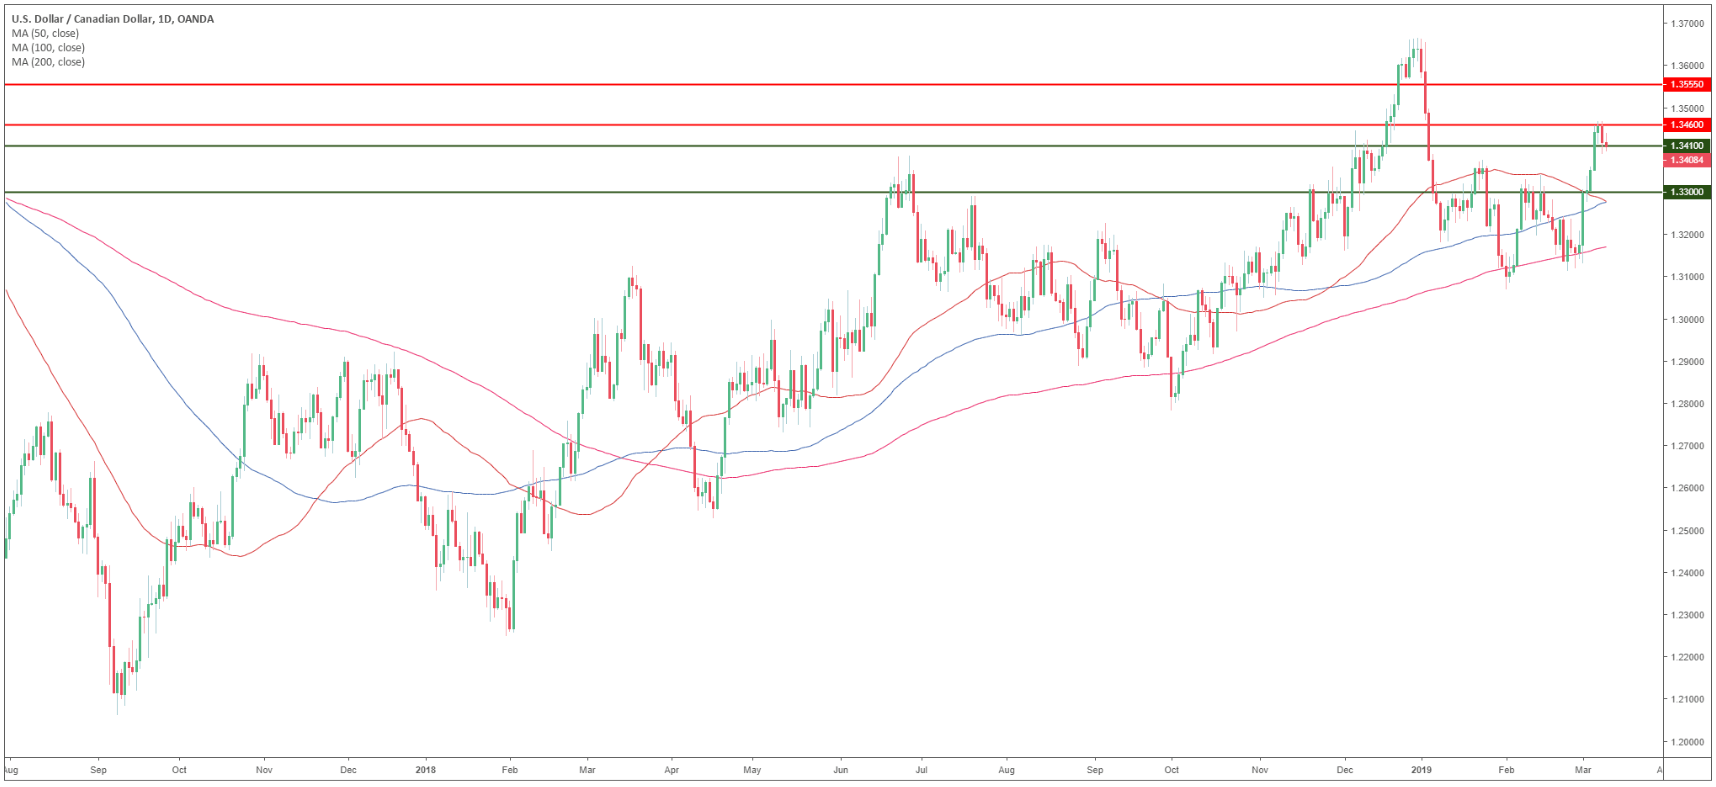
USD/CAD daily chart
- USD/CAD is trading in a bull trend above its main simple moving averages (SMAs).
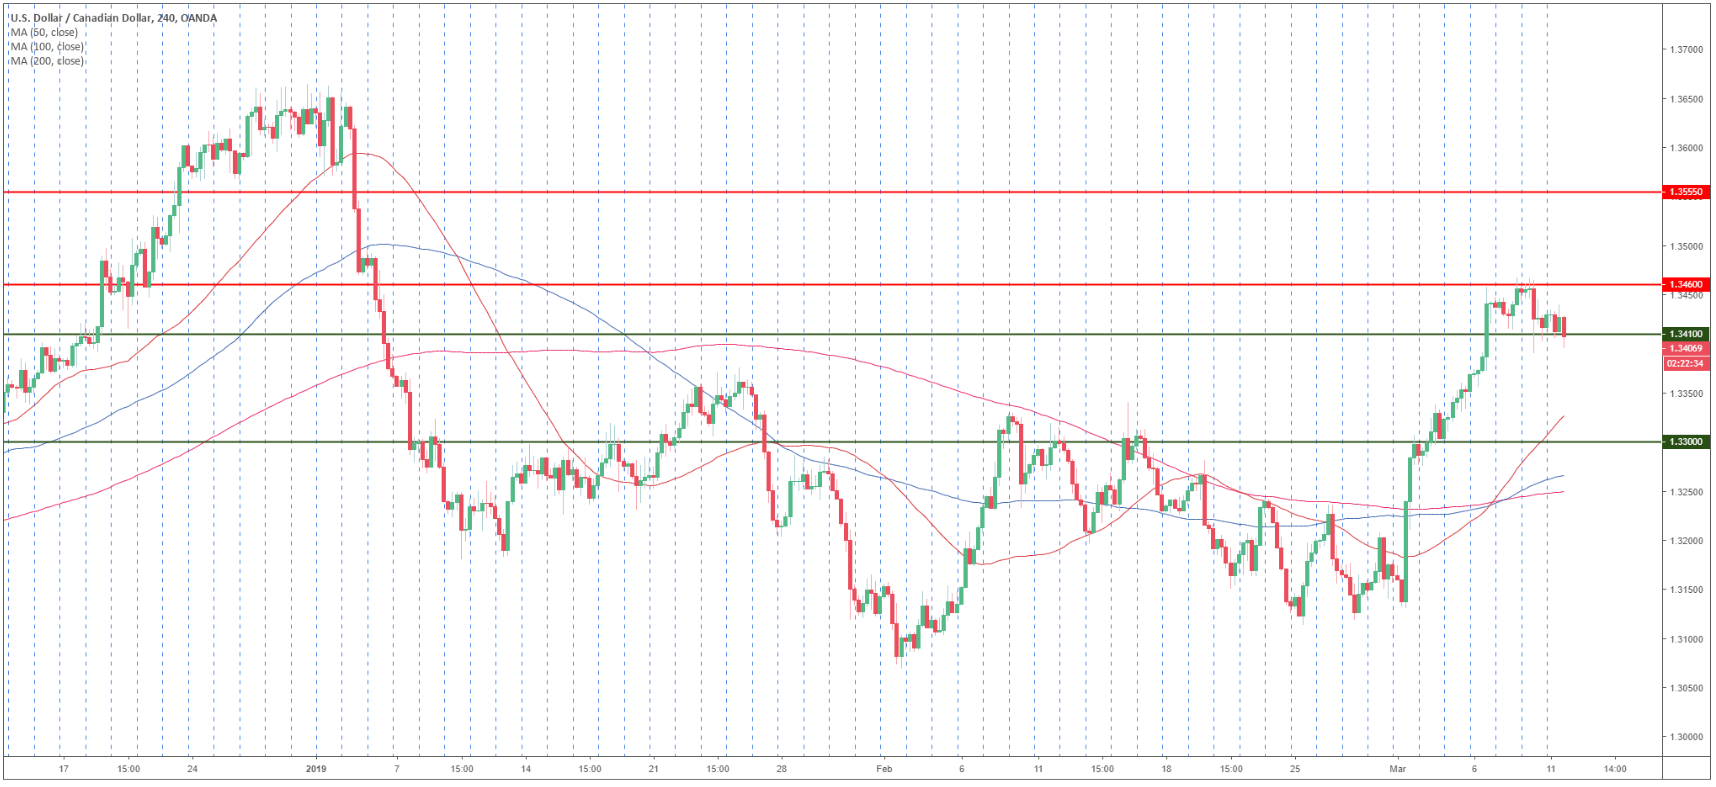
USD/CAD 4-hour chart
- USD/CAD is trading above its main SMAs suggesting bullish momentum.
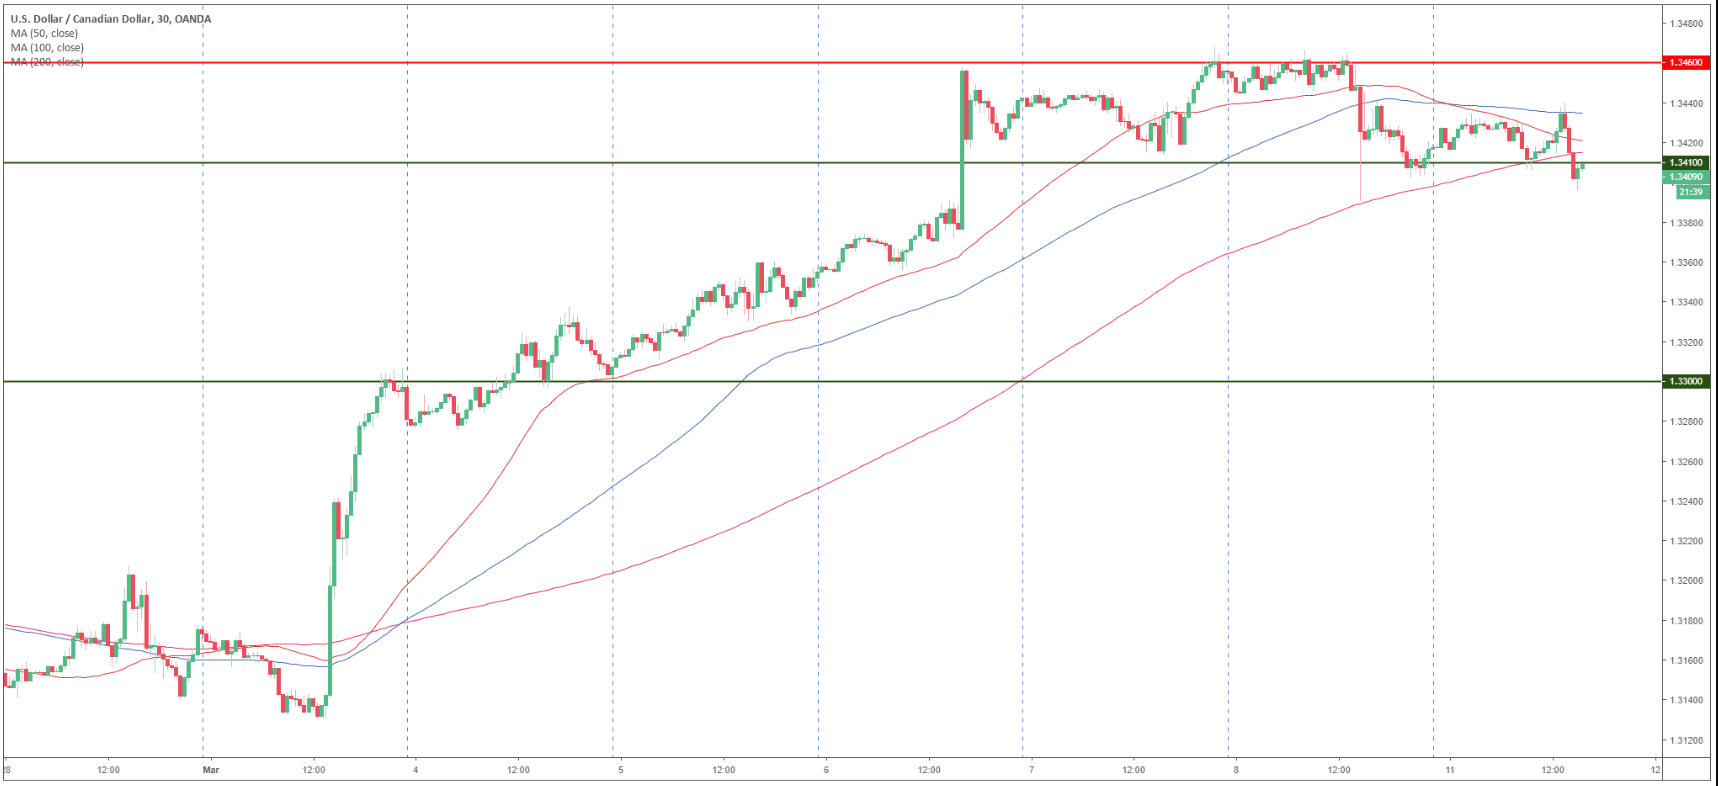
USD/CAD 30-minute chart
- USD/CAD is trading below its main SMAs suggesting bearish momentum in the short-term.
- A break below 1.3410 can lead to 1.3300 figure.
- Resistance is at 1.3460 level.
Additional key levels
USD/CAD
Overview:
Today Last Price: 1.341
Today Daily change: 3 pips
Today Daily change %: 0.02%
Today Daily Open: 1.3407
Trends:
Daily SMA20: 1.3263
Daily SMA50: 1.3283
Daily SMA100: 1.3289
Daily SMA200: 1.3177
Levels:
Previous Daily High: 1.3466
Previous Daily Low: 1.339
Previous Weekly High: 1.3469
Previous Weekly Low: 1.3275
Previous Monthly High: 1.3341
Previous Monthly Low: 1.3069
Daily Fibonacci 38.2%: 1.3419
Daily Fibonacci 61.8%: 1.3437
Daily Pivot Point S1: 1.3376
Daily Pivot Point S2: 1.3345
Daily Pivot Point S3: 1.33
Daily Pivot Point R1: 1.3452
Daily Pivot Point R2: 1.3497
Daily Pivot Point R3: 1.3528
