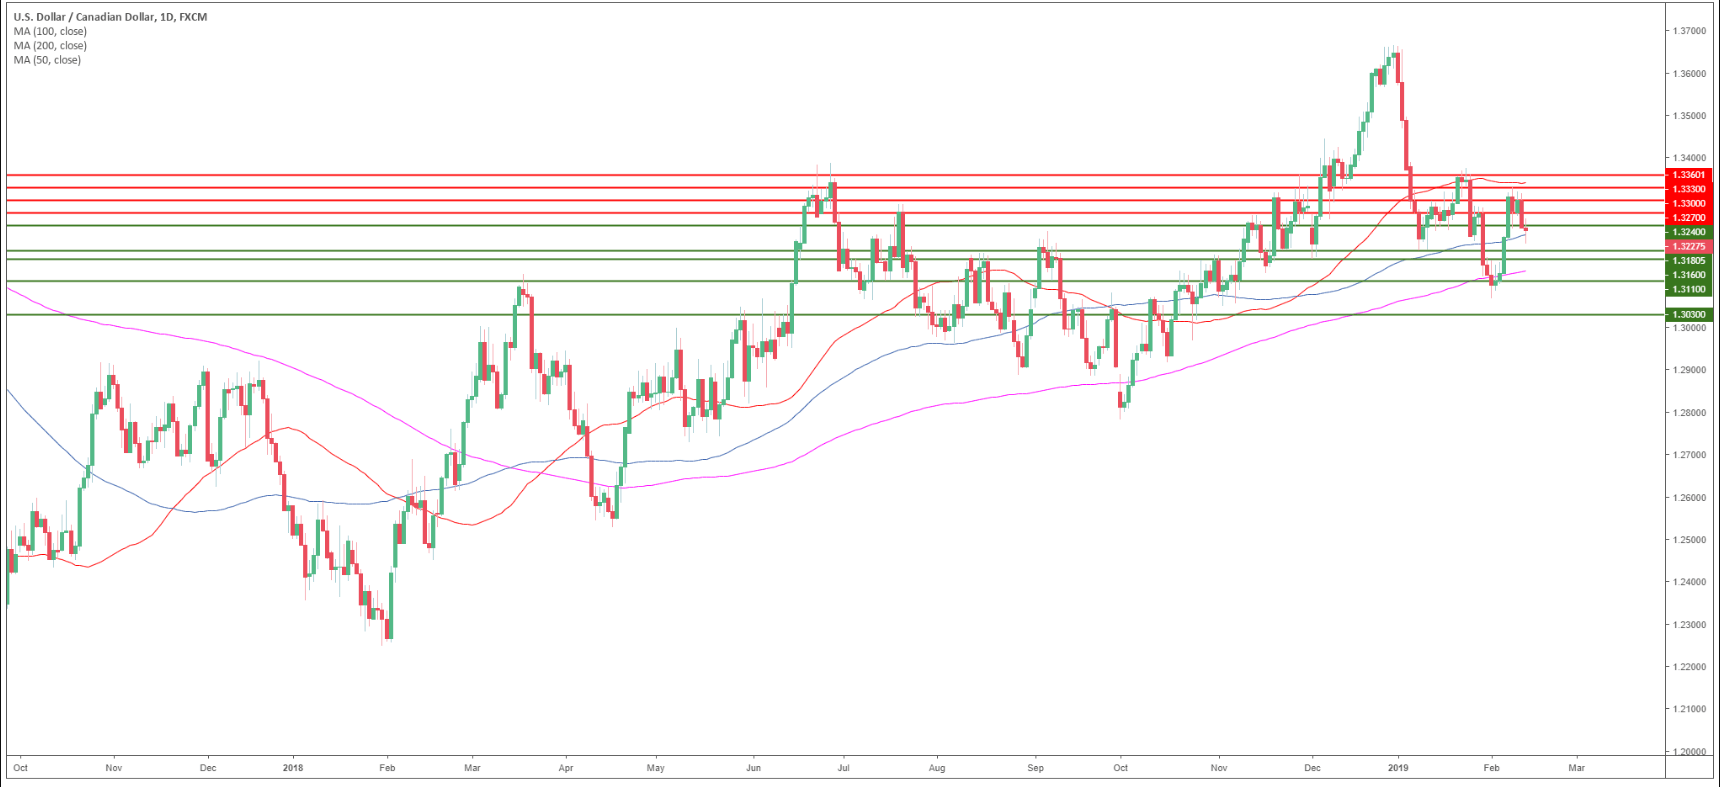
USD/CAD daily chart
- USD/CAD is trading in a bull trend above the 200-day simple moving average (SMA).
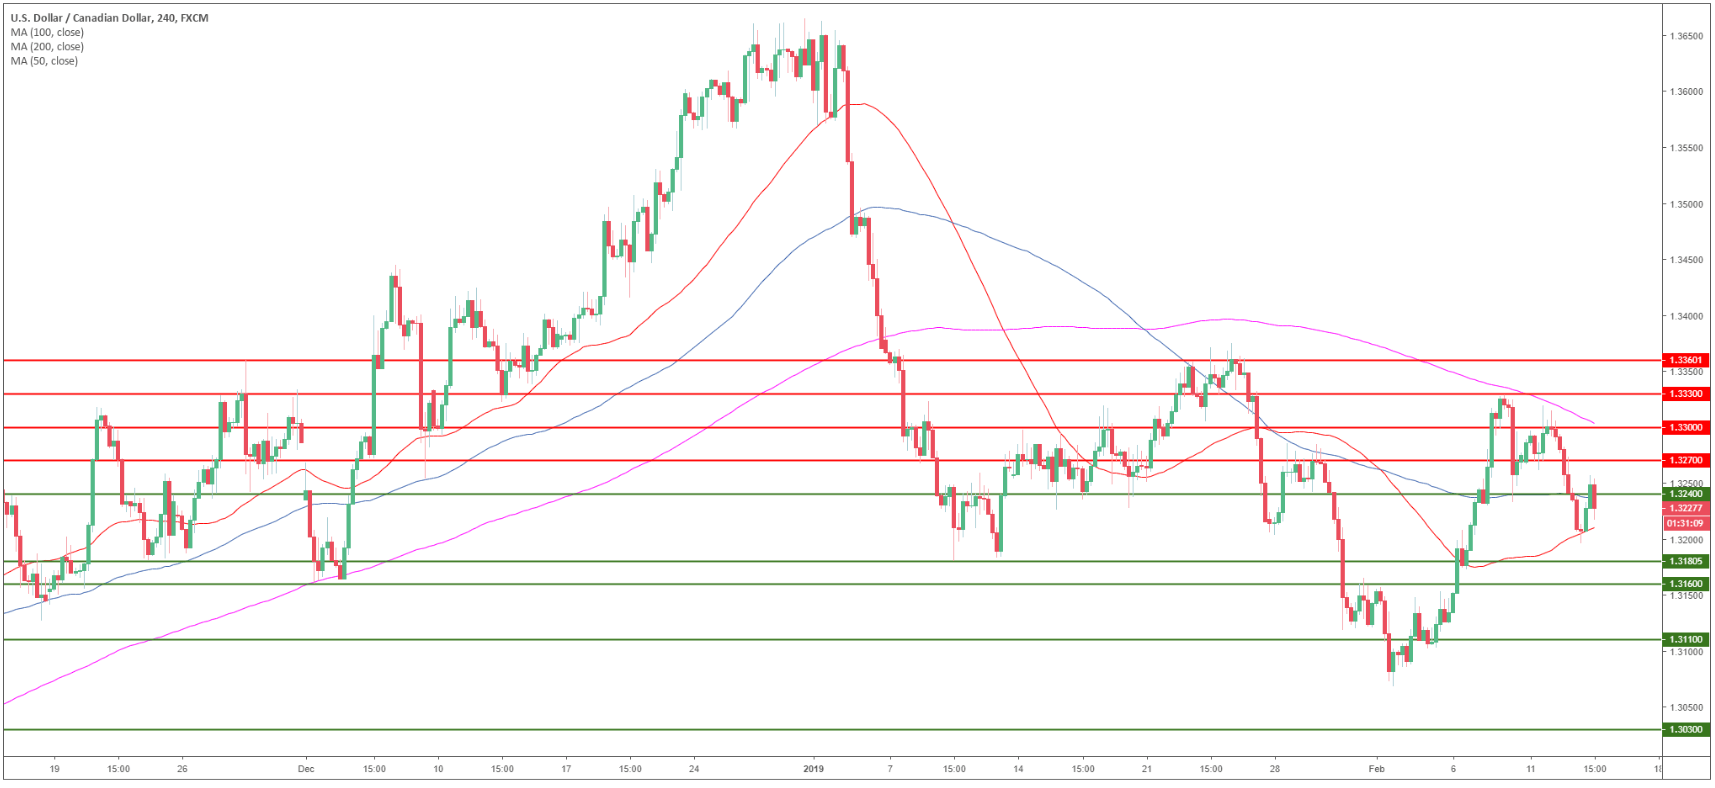
USD/CAD 4-hour chart
- USD/CAD is trading between the 100 and 200 SMA suggesting a sideways market in the medium-term.
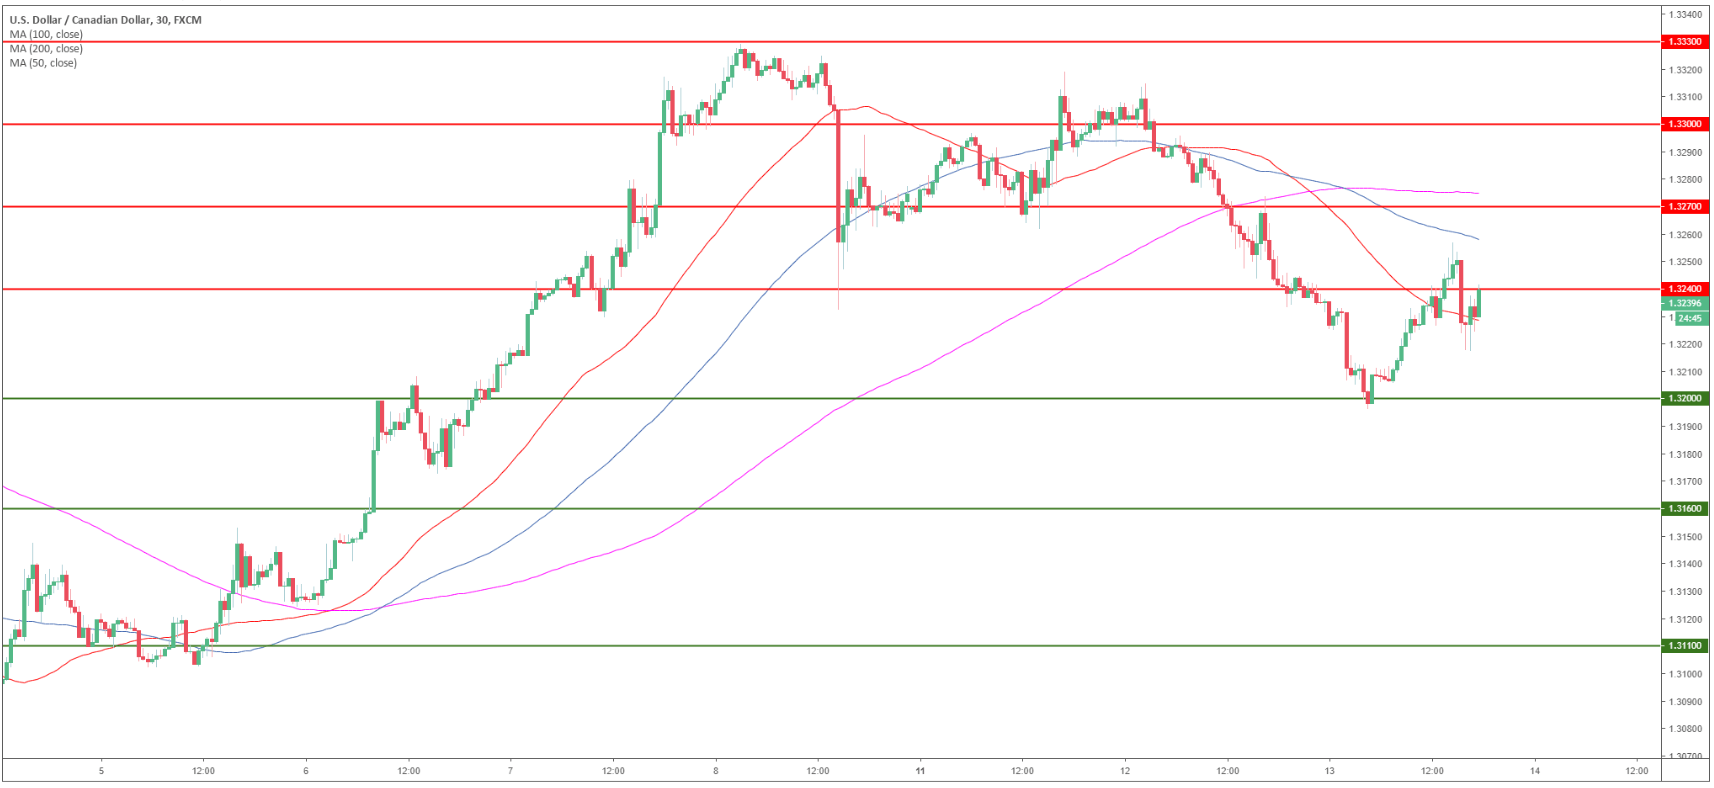
USD/CAD 30-minute chart
- USD/CAD is trading below its 100 and 200 SMAs suggesting bearish momentum in the short-term.
- Bears will try to reach 1.3200 figure to the downside.
- Resistance is seen at 1.3240 and 1.3270 levels.
Additional key levels
USD/CAD
Overview:
Today Last Price: 1.323
Today Daily change: -9 pips
Today Daily change %: -0.07%
Today Daily Open: 1.3239
Trends:
Daily SMA20: 1.3242
Daily SMA50: 1.3368
Daily SMA100: 1.3237
Daily SMA200: 1.3142
Levels:
Previous Daily High: 1.3316
Previous Daily Low: 1.3233
Previous Weekly High: 1.333
Previous Weekly Low: 1.3084
Previous Monthly High: 1.3664
Previous Monthly Low: 1.3118
Daily Fibonacci 38.2%: 1.3265
Daily Fibonacci 61.8%: 1.3284
Daily Pivot Point S1: 1.321
Daily Pivot Point S2: 1.318
Daily Pivot Point S3: 1.3128
Daily Pivot Point R1: 1.3292
Daily Pivot Point R2: 1.3345
Daily Pivot Point R3: 1.3374
