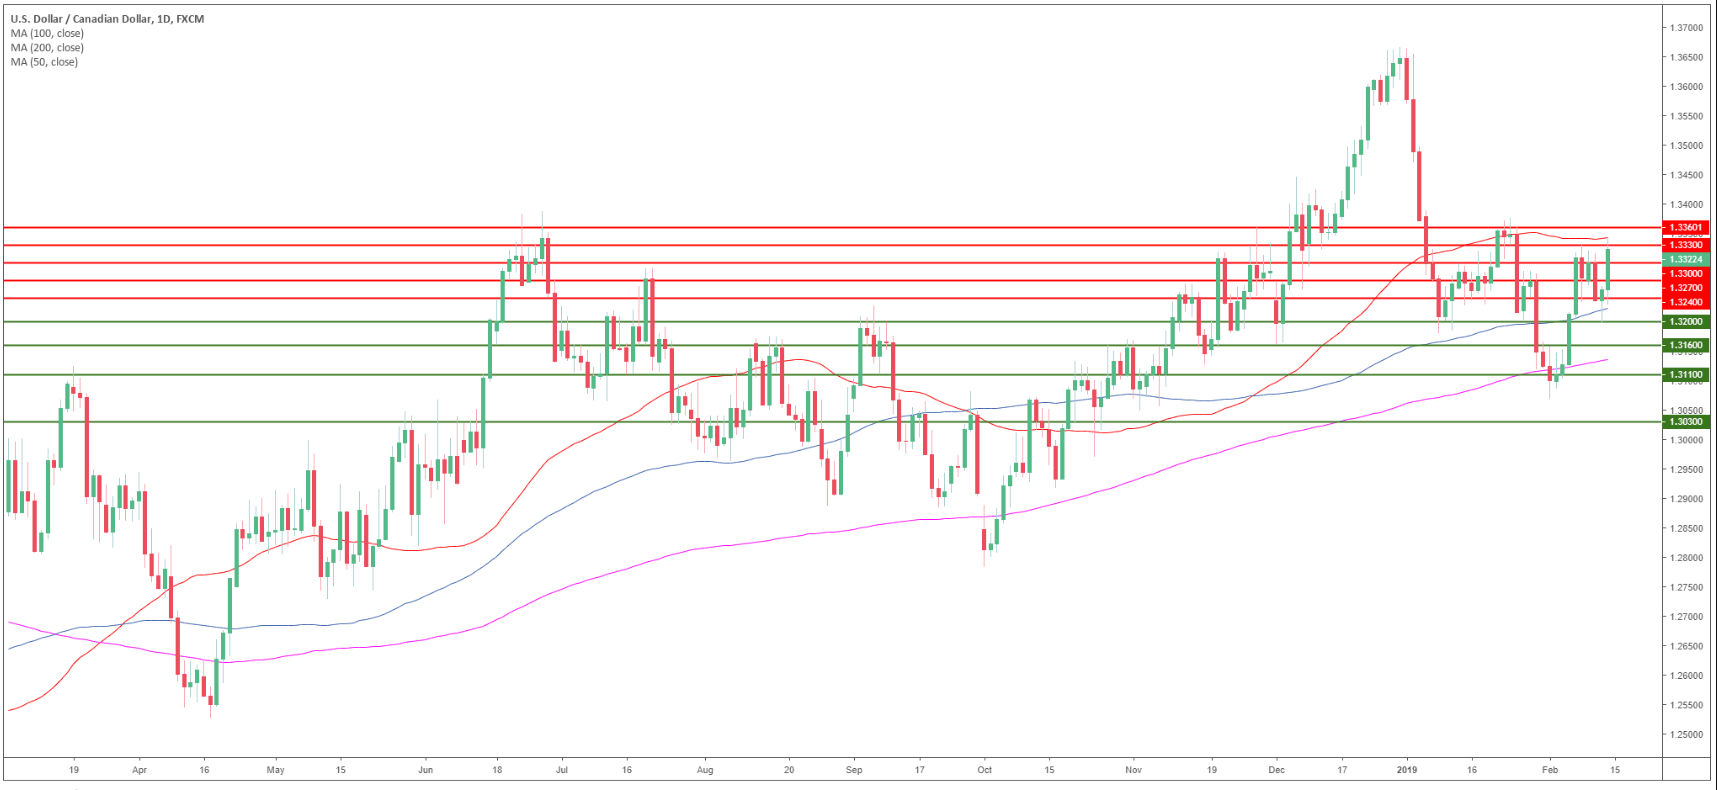
USD/CAD daily chart
- USD/CAD is trading between the 50 and the 100-day simple moving averages (SMAs) suggesting a sideways market.
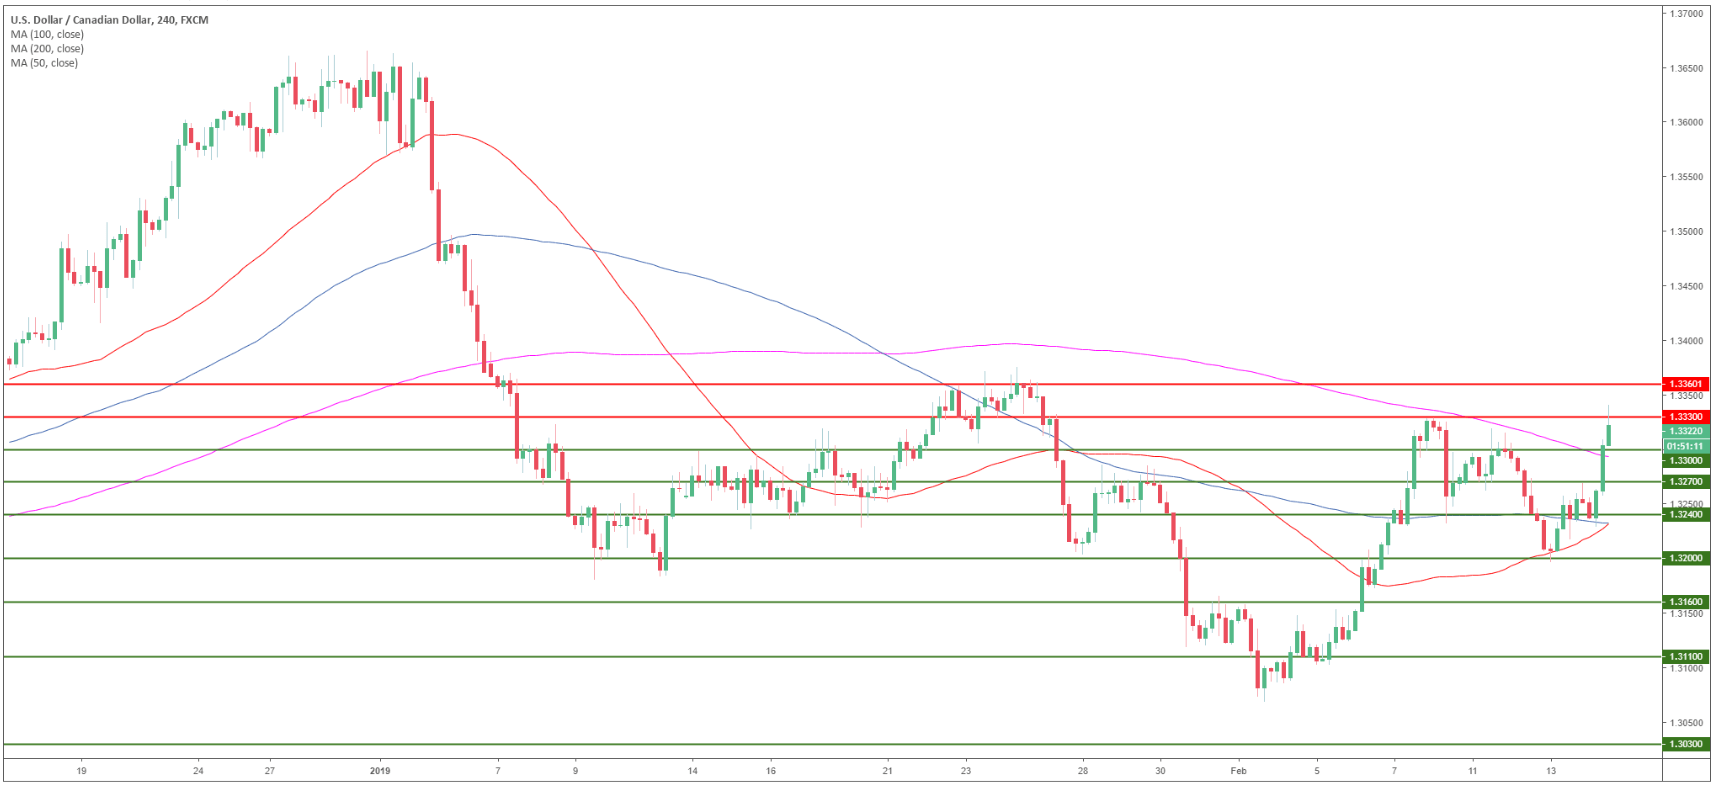
USD/CAD 4-hour chart
- USD/CAD is trading above its main SMA suggesting a bullish bias in the medium-term.
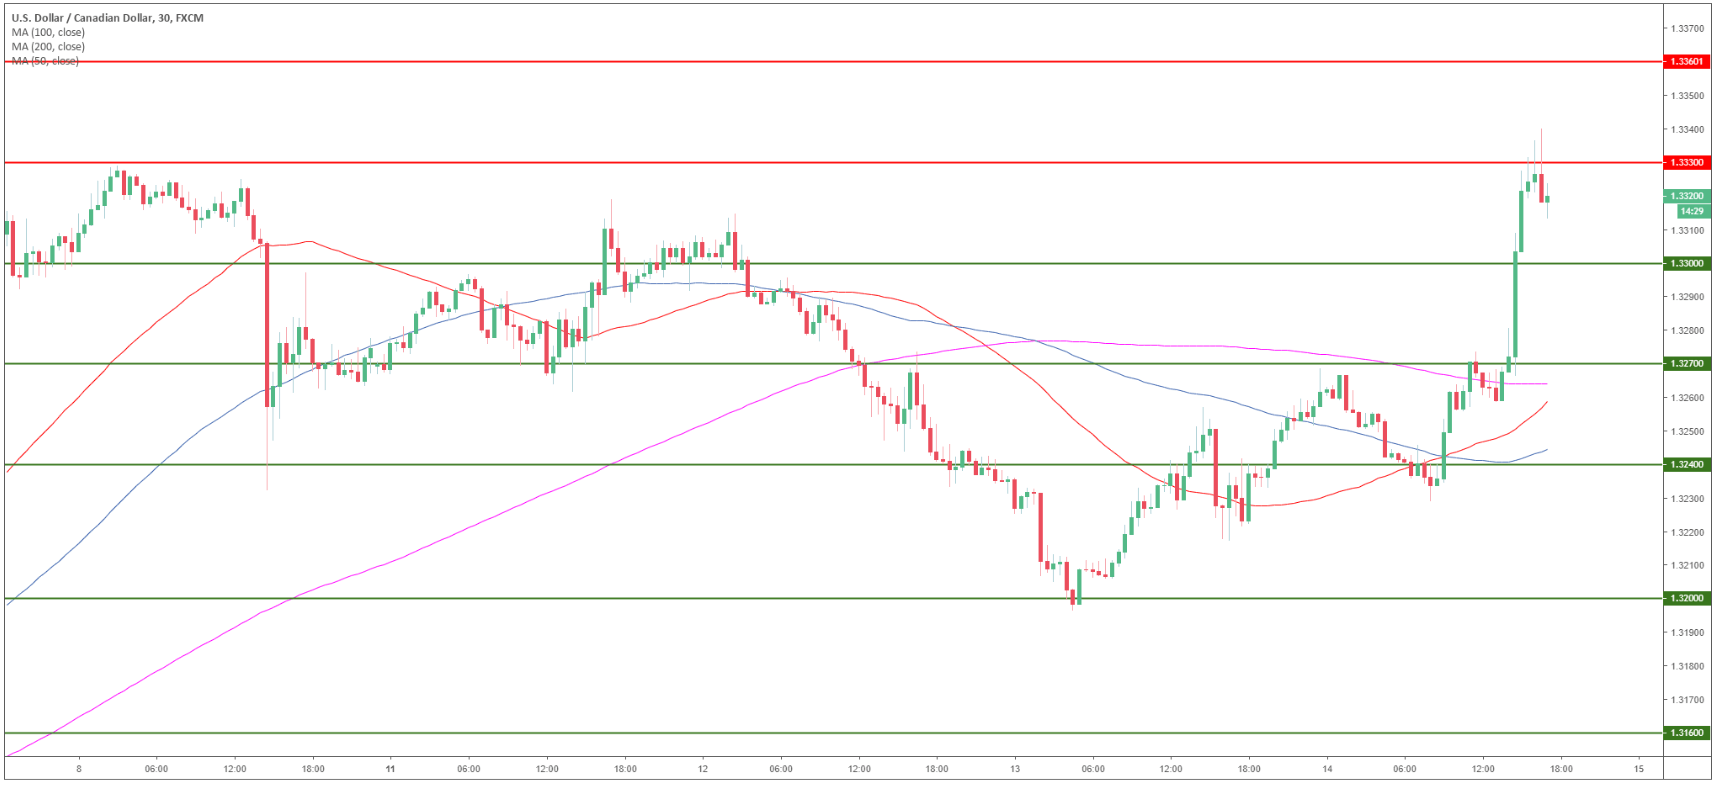
USD/CAD 30-minute chart
- USD/CAD is trading above its main SMAs suggesting bullish momentum in the short-term.
- Bulls need to break 1.3330 figure to reach 1.3360 to the upside.
- Support is seen at 1.3300 and 1.3270 level.
Additional key levels
USD/CAD
Overview:
Today Last Price: 1.3318
Today Daily change: 65 pips
Today Daily change %: 0.49%
Today Daily Open: 1.3253
Trends:
Daily SMA20: 1.3242
Daily SMA50: 1.3366
Daily SMA100: 1.3239
Daily SMA200: 1.3143
Levels:
Previous Daily High: 1.3258
Previous Daily Low: 1.3196
Previous Weekly High: 1.333
Previous Weekly Low: 1.3084
Previous Monthly High: 1.3664
Previous Monthly Low: 1.3118
Daily Fibonacci 38.2%: 1.3235
Daily Fibonacci 61.8%: 1.322
Daily Pivot Point S1: 1.3213
Daily Pivot Point S2: 1.3174
Daily Pivot Point S3: 1.3151
Daily Pivot Point R1: 1.3275
Daily Pivot Point R2: 1.3298
Daily Pivot Point R3: 1.3338
