- USD/CAD broke above the 1.2900 figure confirming the bullish momentum.
- USD/CAD bulls next objective is to break above 1.2950 multi-month resistance and the 100-period simple moving average. A break of the level can open the doors to 1.3000 figure. The RSI, MACD and Stochastics are confirming the bullish bias.
- Alternatively, failure to break above 1.2950 can lead to a rotation back down towards 1.2800.
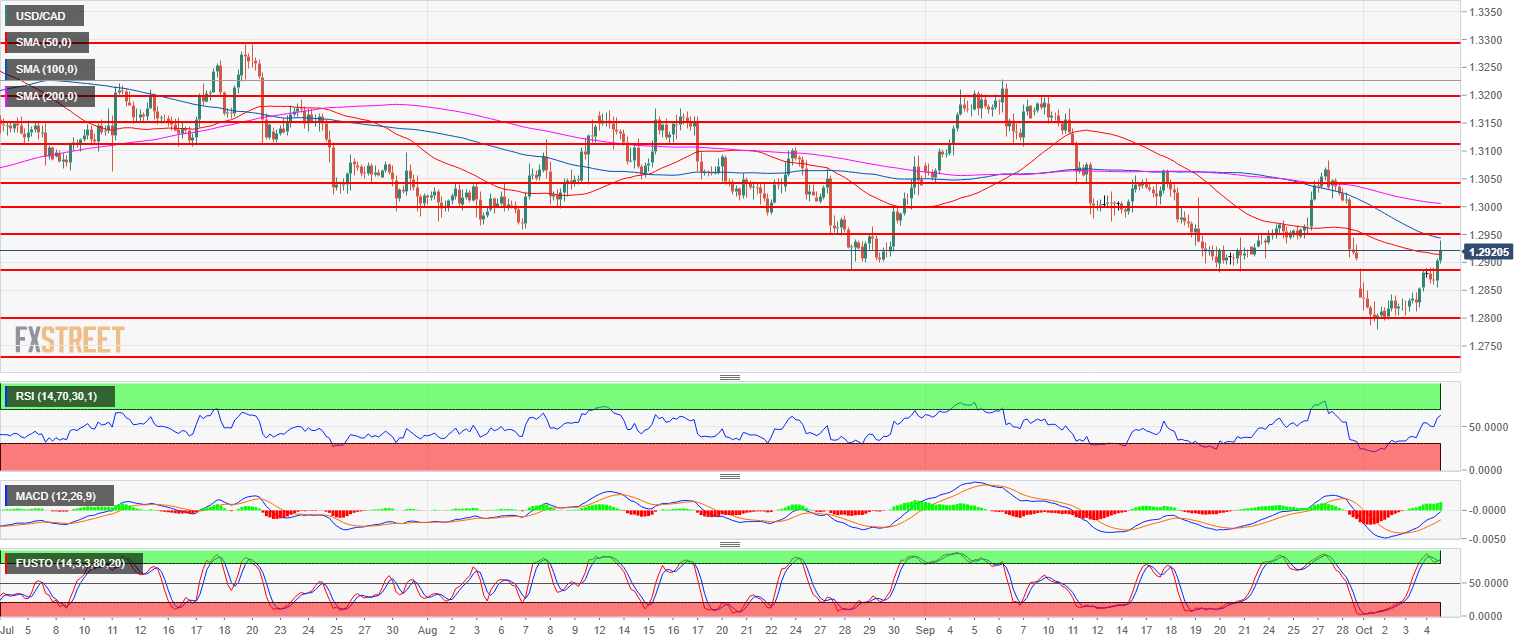
Spot rate: 1.2920
Relative change: 0.38%
High: 1.2939
Low: 1.2855
Main trend: Neutral
Resistances and Supports:
Resistance 1: 1.2950-59 multi-month resistance and August 7 low
Resistance 2: 1.3000 figure
Resistance 3: 1.3048 August 14 low
Resistance 4: 1.3108, September 7 low
Resistance 5: 13200 figure
Support 1: 1.2882-1.2900 September 20 low and figure
Support 2: 1.2855-65 June 6 low – 200-day SMA
Support 3: 1.2800 figure
Support 4: 1.2727 May 11 low
Support 5: 1.2600 figure
