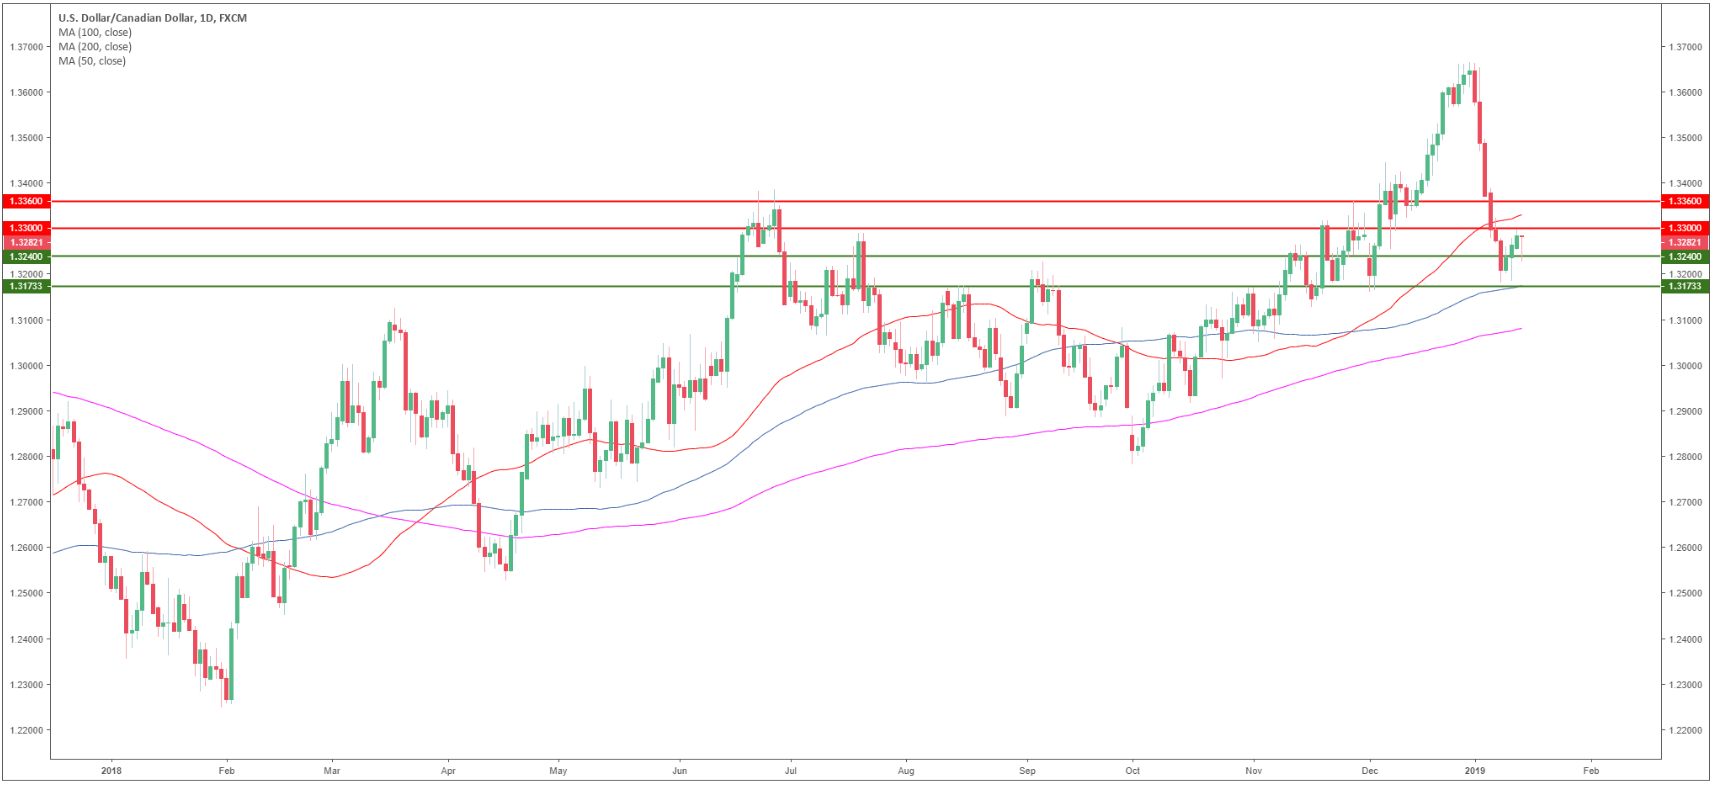
USD/CAD daily chart
- USD/CAD is trading in a bull trend above the 200-period simple moving average (SMA).
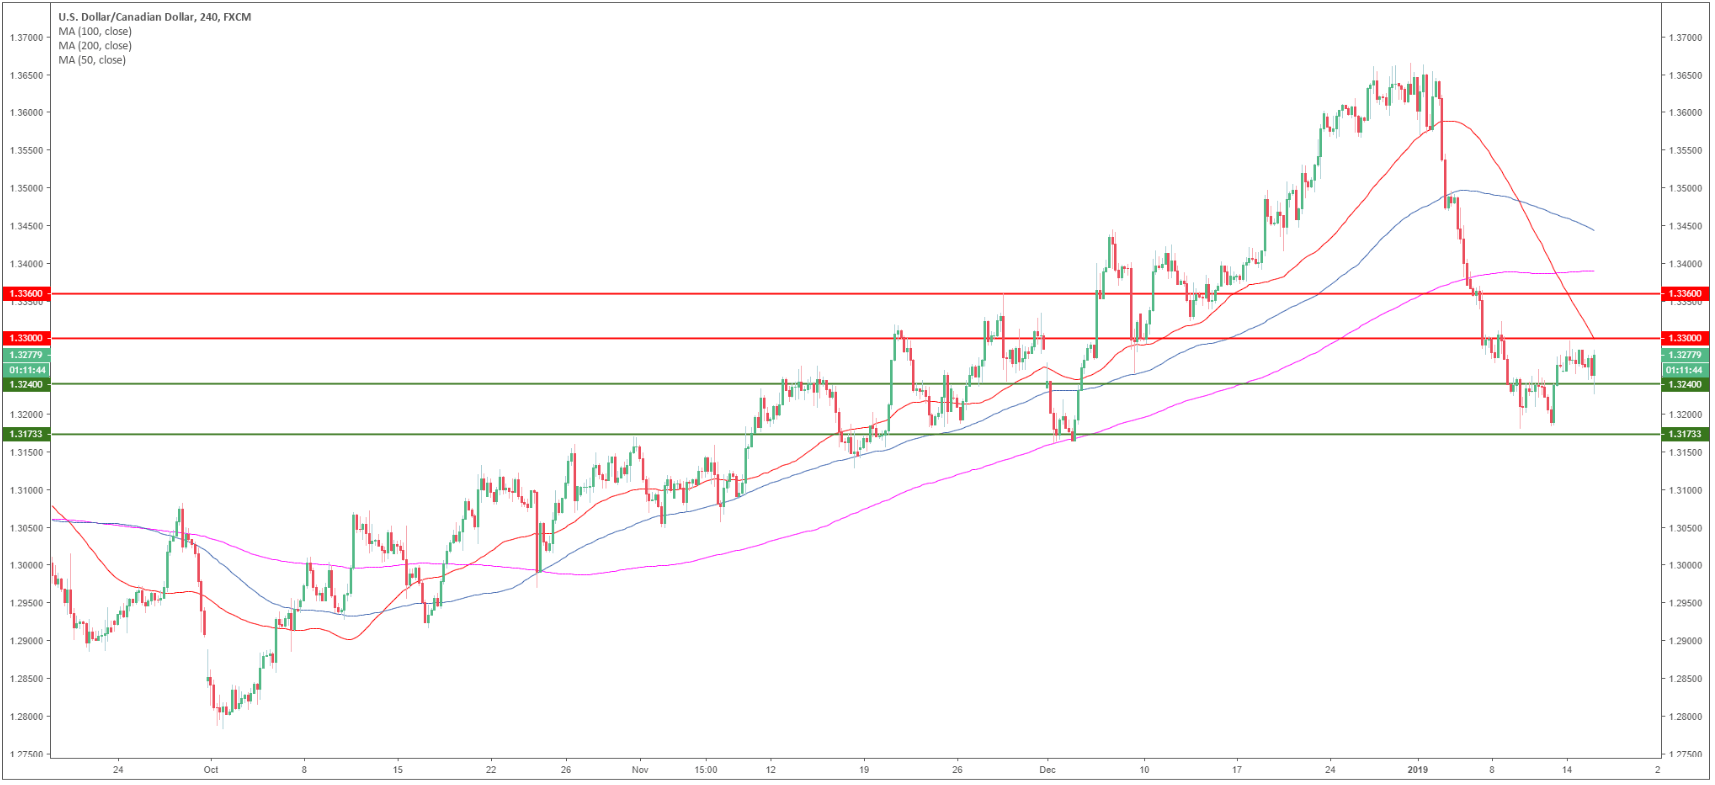
USD/CAD 4-hour chart
- USD/CAD is trading below its main SMAs.
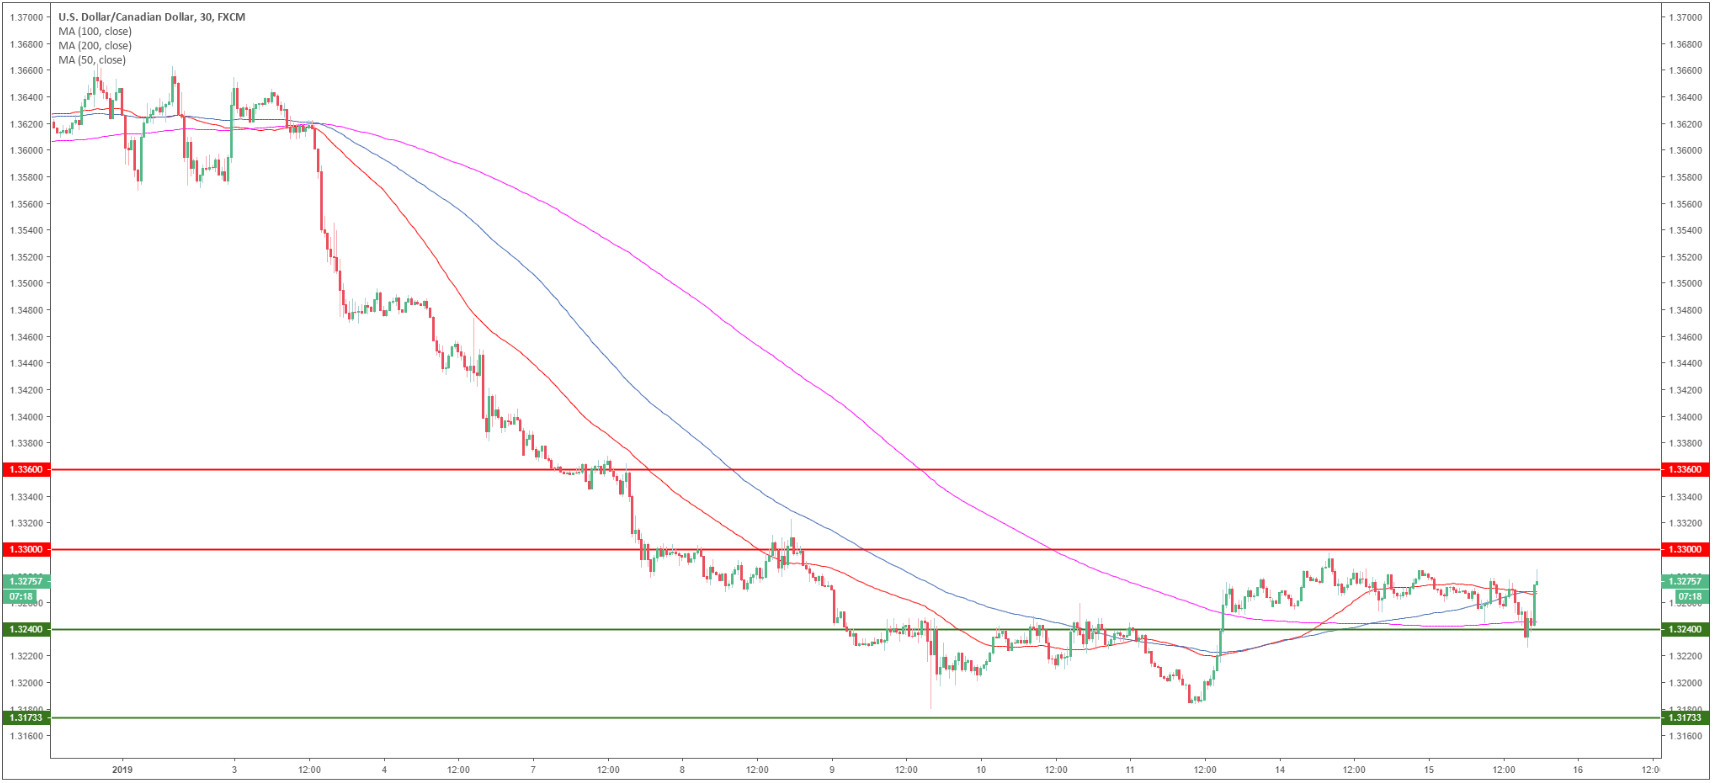
USD/CAD 30-minute chart
- USD/CAD is set to retest the 1.3300 figure
- If bulls manage to break the 1.3300 resistance the next destination become the 1.3360 level.
Additional key levels
USD/CAD
Overview:
Today Last Price: 1.3282
Today Daily change: 7.0 pips
Today Daily change %: 0.0527%
Today Daily Open: 1.3275
Trends:
Previous Daily SMA20: 1.3497
Previous Daily SMA50: 1.3359
Previous Daily SMA100: 1.319
Previous Daily SMA200: 1.3089
Levels:
Previous Daily High: 1.3298
Previous Daily Low: 1.3252
Previous Weekly High: 1.339
Previous Weekly Low: 1.318
Previous Monthly High: 1.4134
Previous Monthly Low: 1.316
Previous Daily Fibonacci 38.2%: 1.3281
Previous Daily Fibonacci 61.8%: 1.327
Previous Daily Pivot Point S1: 1.3252
Previous Daily Pivot Point S2: 1.3229
Previous Daily Pivot Point S3: 1.3206
Previous Daily Pivot Point R1: 1.3298
Previous Daily Pivot Point R2: 1.3321
Previous Daily Pivot Point R3: 1.3344
