- USD/CAD is trading sideways as it is between the 50 and 100-period simple moving averages.
- The 1.3000 level and the 200 SMA are acting as strong resistance as the market seems contained below it for the time being.
- Bulls are slowly coming back but they will need a convincing break above 1.3000 level in order to reach 1.3048 (August 14 low).
USD/CAD 4-hour chart
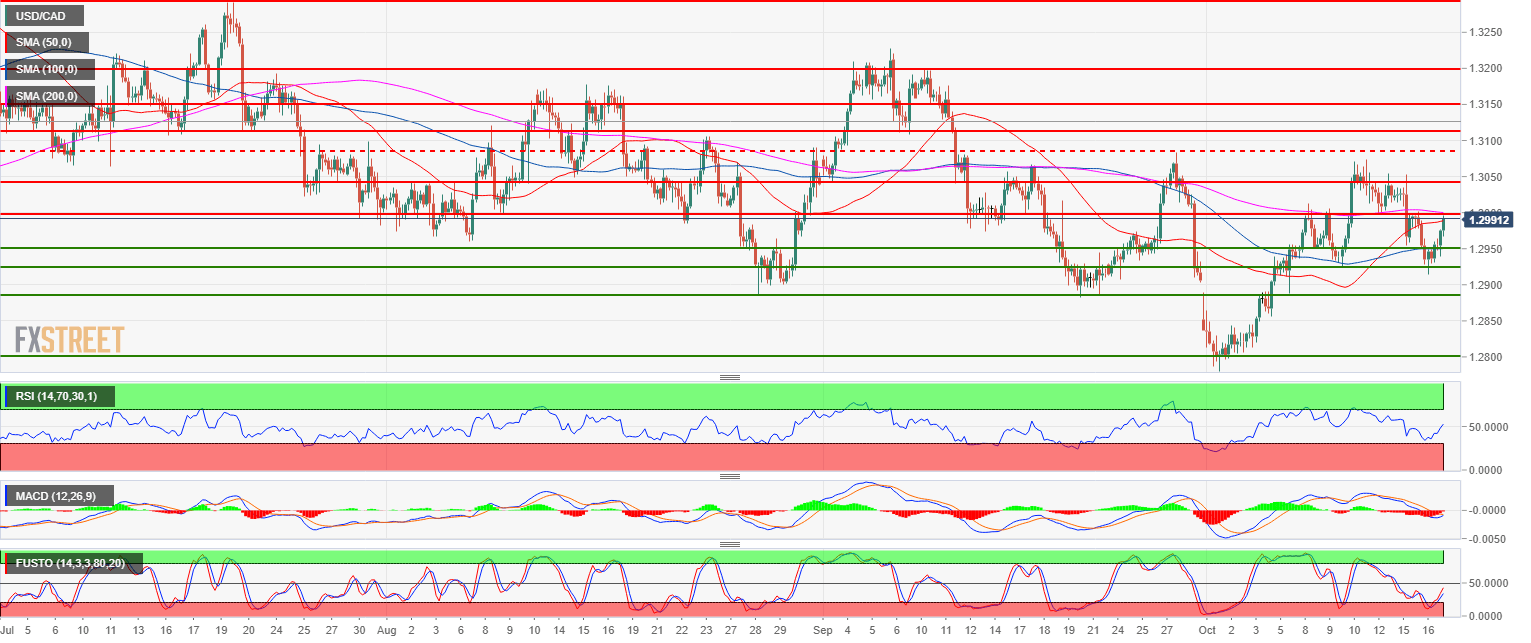
Spot rate: 1.2988
Relative change: 0.43%
High: 1.2995
Low: 1.2932
Main trend: Neutral
Resistance 1: 1.3000 figure
Resistance 2: 1.3048 August 14 low
Resistance 3: 1.3083 September 27 swing high
Resistance 4: 1.3108, September 7 low
Resistance 5: 1.3200 figure
Support 1: 1.2950-59 multi-month key level and August 7 low
Support 2: 1.2924 October 10 low
Support 3: 1.2882-1.2900 zone September 20 low and figure
Support 4: 1.2855-65 June 6 low – 200-day SMA
Support 5: 1.2800 figure
Support 6: 1.2727 May 11 low
