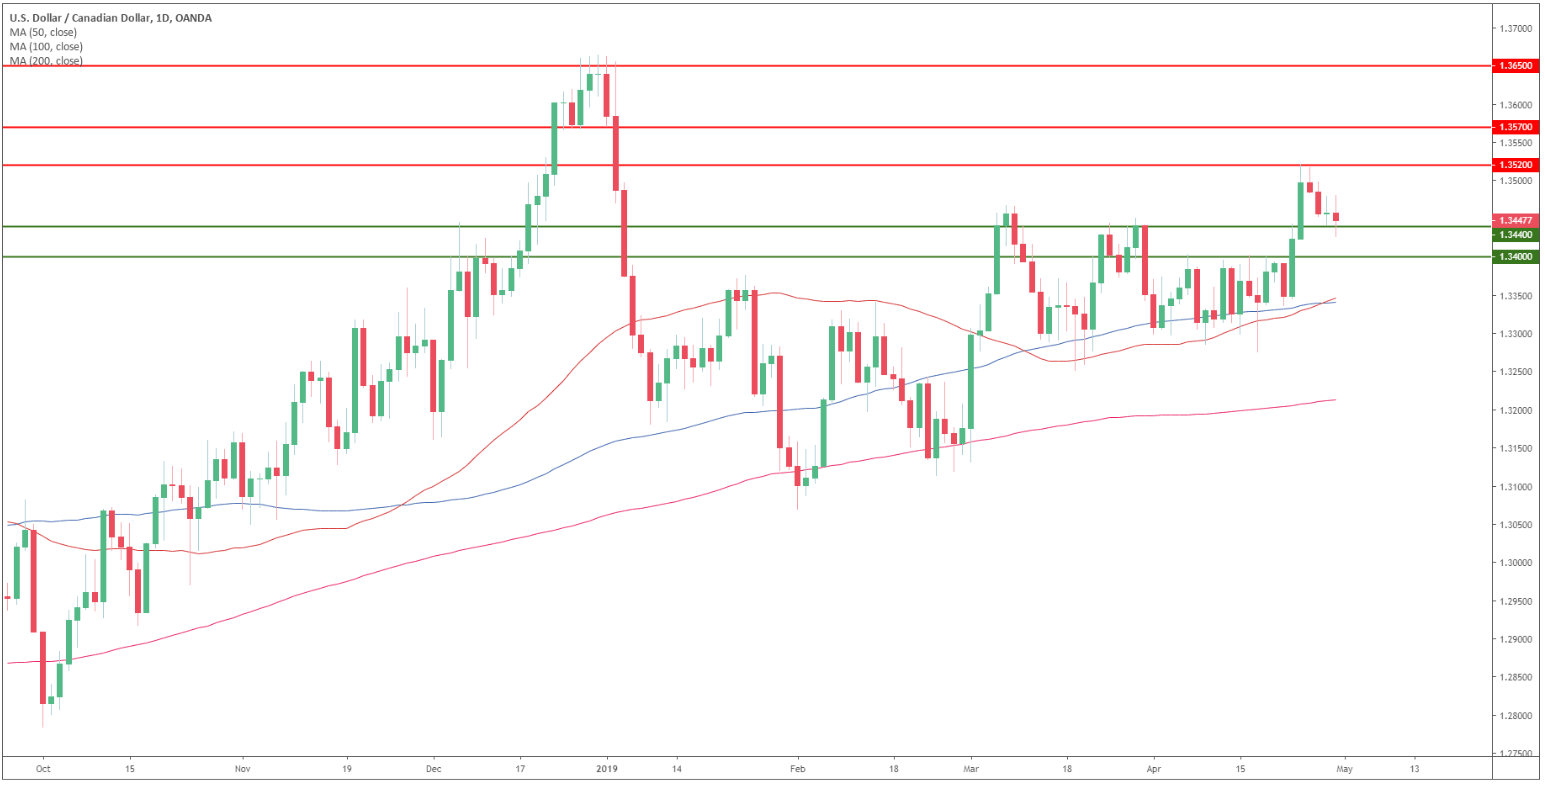
USD/CAD daily chart
- USD/CAD is trading in a bull trend above its 200 simple moving average (SMA).
- USD/CAD found resistance at 1.3520 resistance and has been retracing towards 1.3440 support.
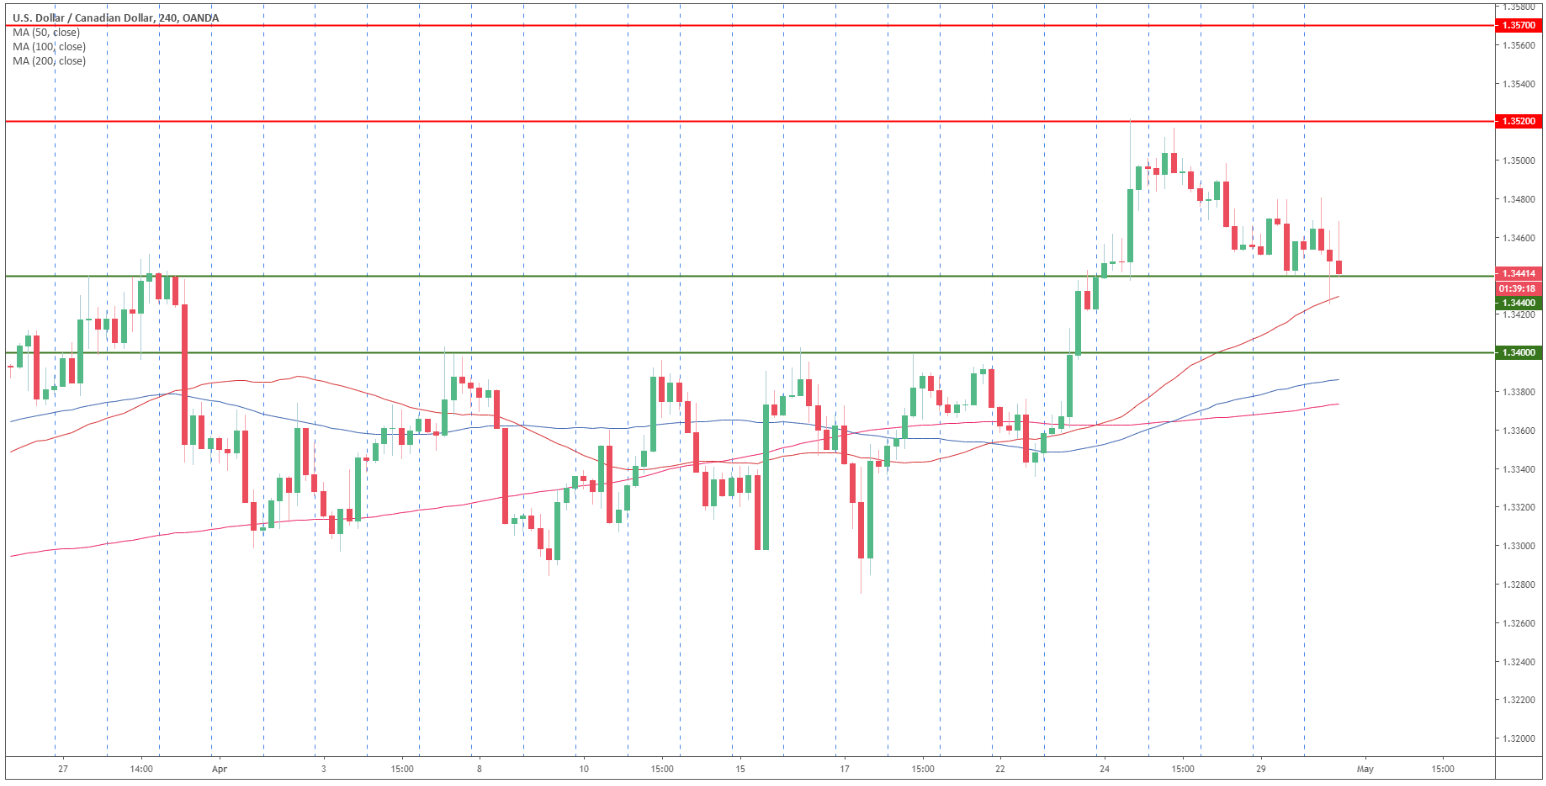
USD/CAD 4-hour chart
- USD/CAD is trading above its main SMAs suggesting bullish momentum.
- If the current correction down break 1.3440 then a drop towards 1.3400 can be on the cards.
- Resistance is seen at 1.3480 and 1.3520 level.
Additional key levels
