- USD/CAD remains bullish above its 200-day simple moving average (DSMA).
- The level to beat for bulls is 1.3400 which is a cluster of many technical levels.
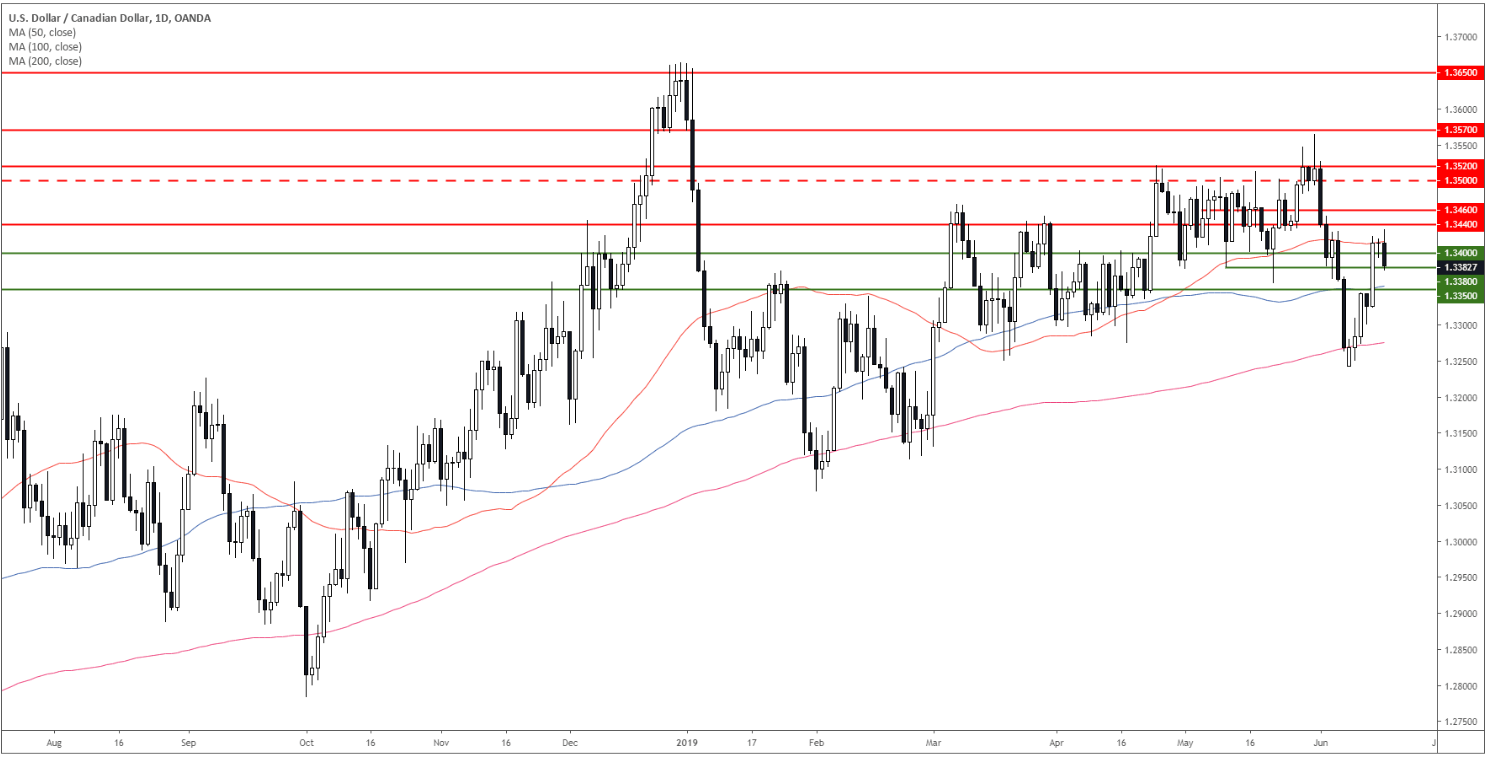
USD/CAD daily chart
USD/CAD is in a bull trend above its 100 and 200-day simple moving average (DSMA). The market found some resistance at 1.3440 and the 50 SMA.

USD/CAD 4-hour chart
USD/CAD is currently rejecting the 1.3400 figure and the 100/200 SMAs. There is strong support at 1.3350, the 100 SMA on the daily chart and the weekly Fibonacci of 38.2%. 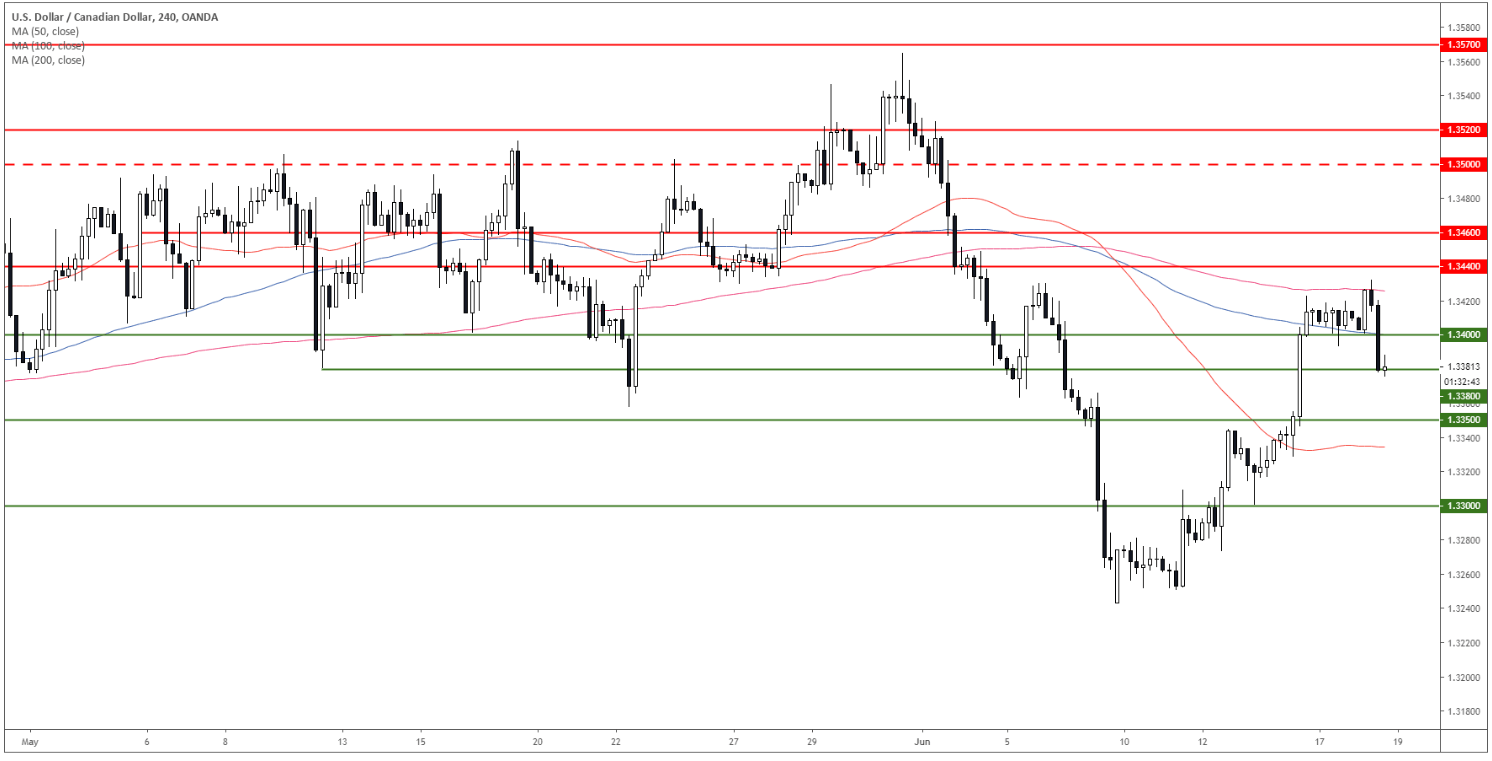
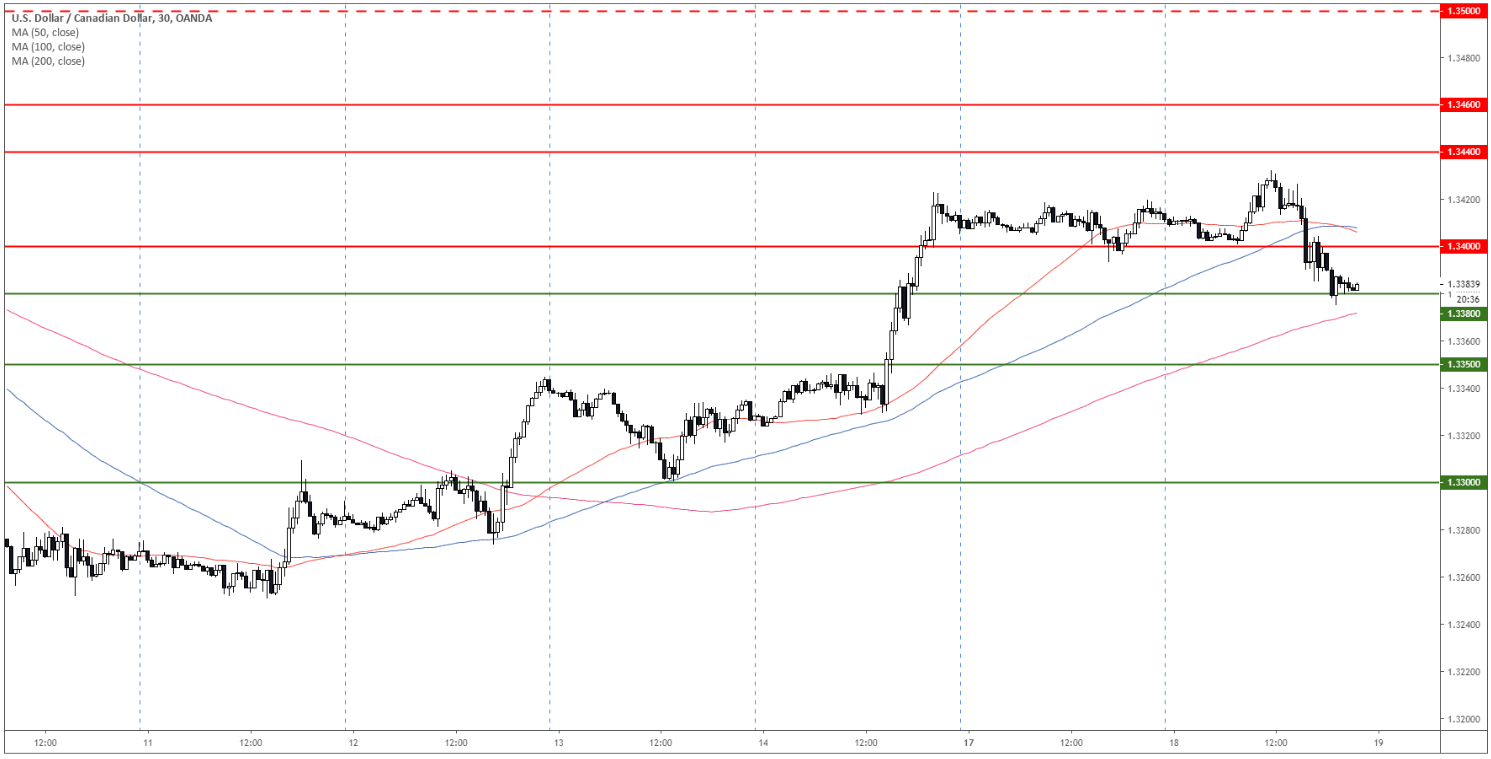
USD/CAD 30-minute chart
The 50 SMA is crossing below the 100 SMA suggesting that the market is losing some bullish momentum in the near term. A break below 1.3380 weak support (weekly Fibonacci of 23.6%) can lead to a drop to 1.3350. On the flip side, resistance is at 1.3400 figure, this level is a cluster of several technical indicators according to the Technical Confluences Indicator. If broken the market could potentially break sharply up towards 1.3500 figure.
Additional key levels
