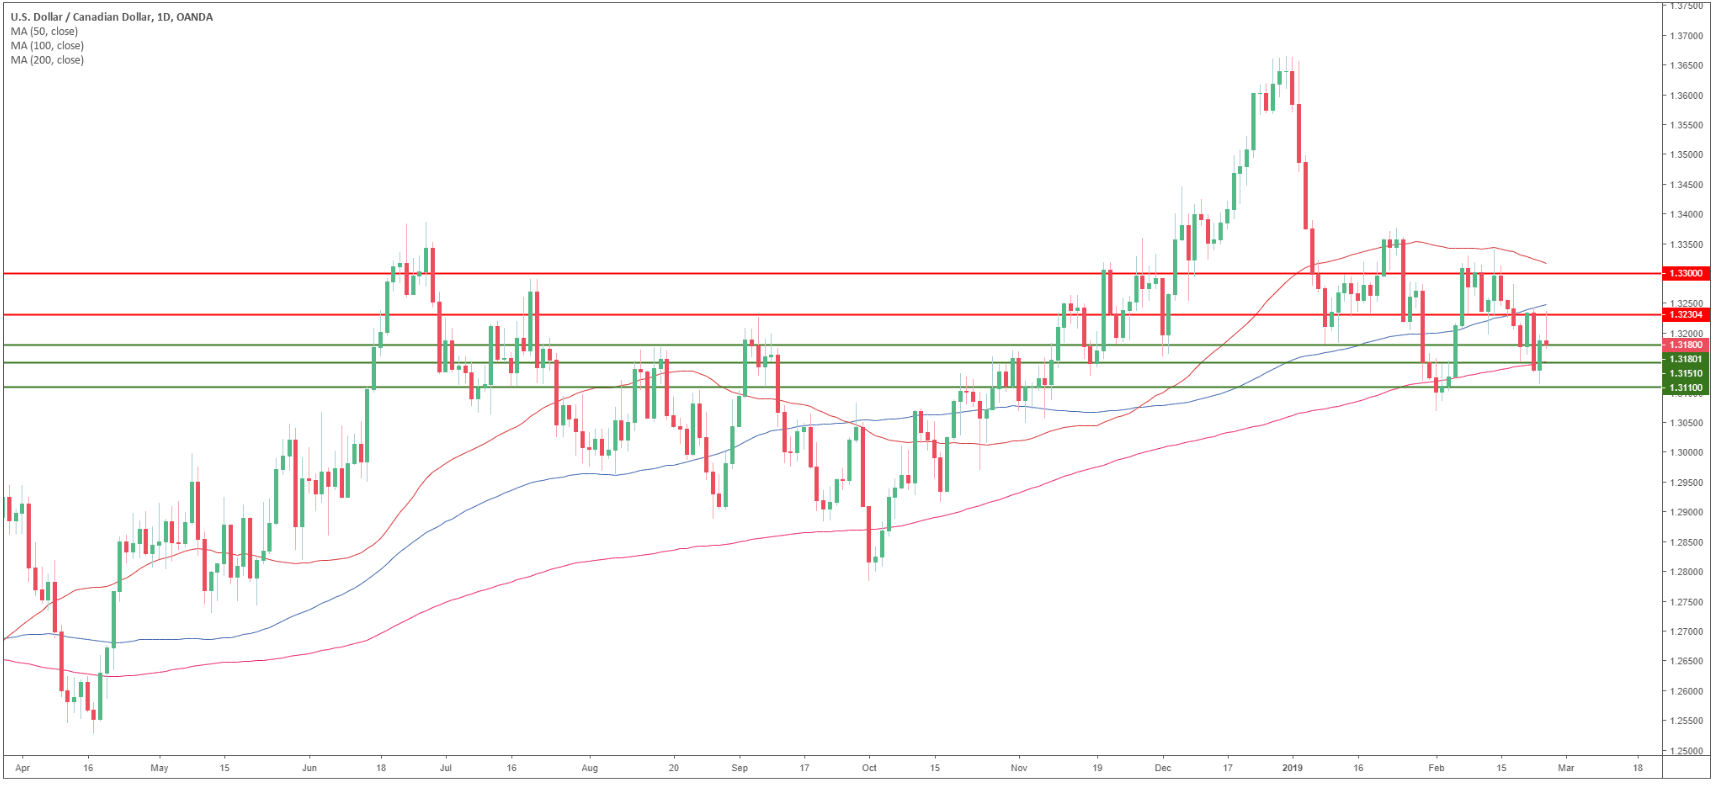
USD/CAD daily chart
- USD/CAD is trading in a bull trend above the 200-day simple moving average (SMA).
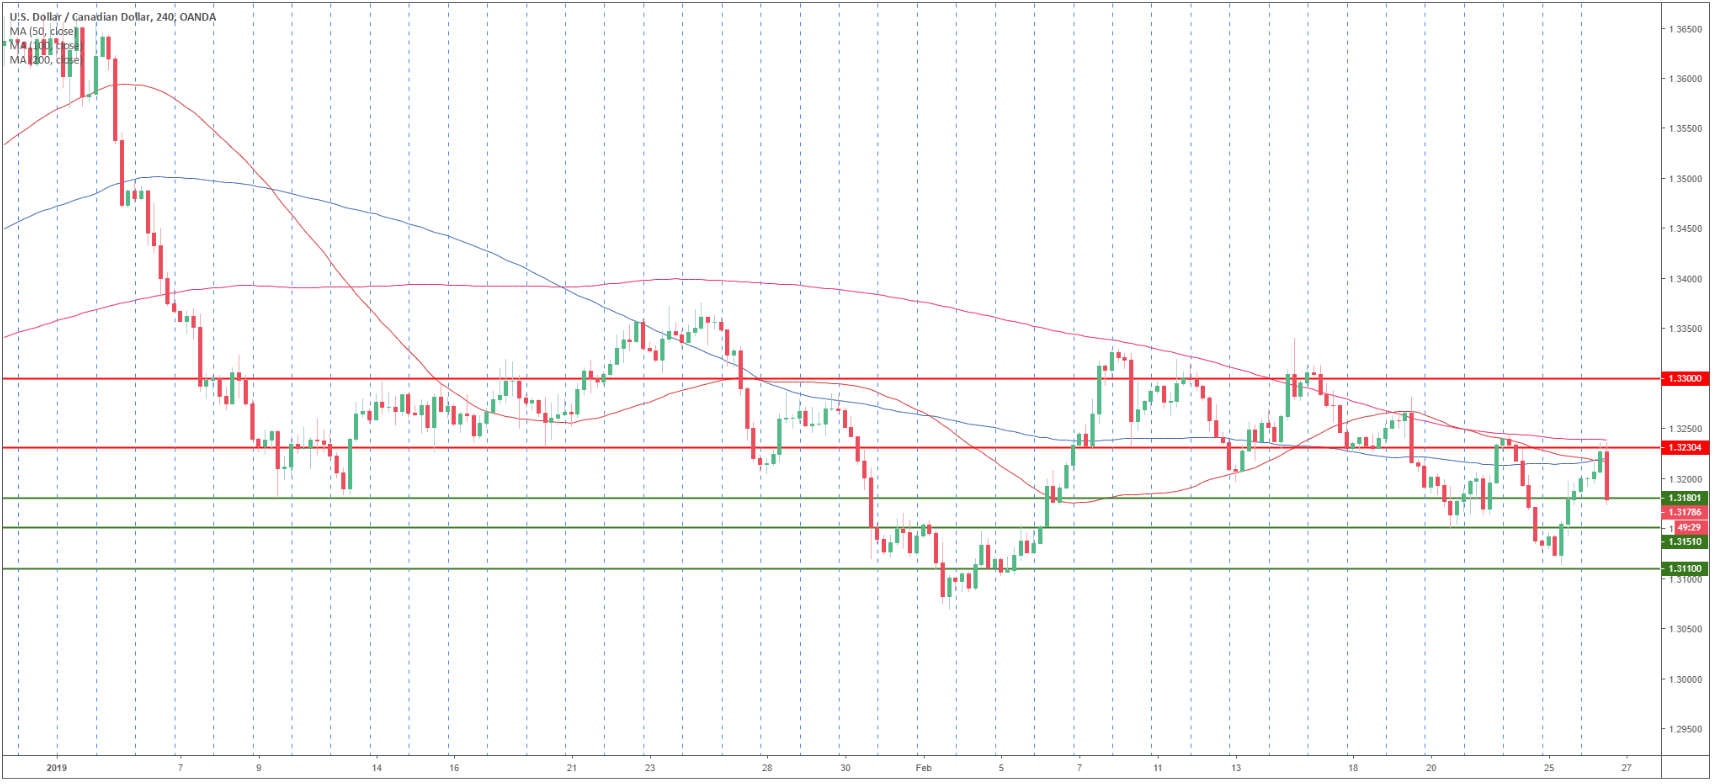
USD/CAD 4-hour chart
- USD/CAD is trading below its main SMAs suggesting a bearish bias in the medium-term.
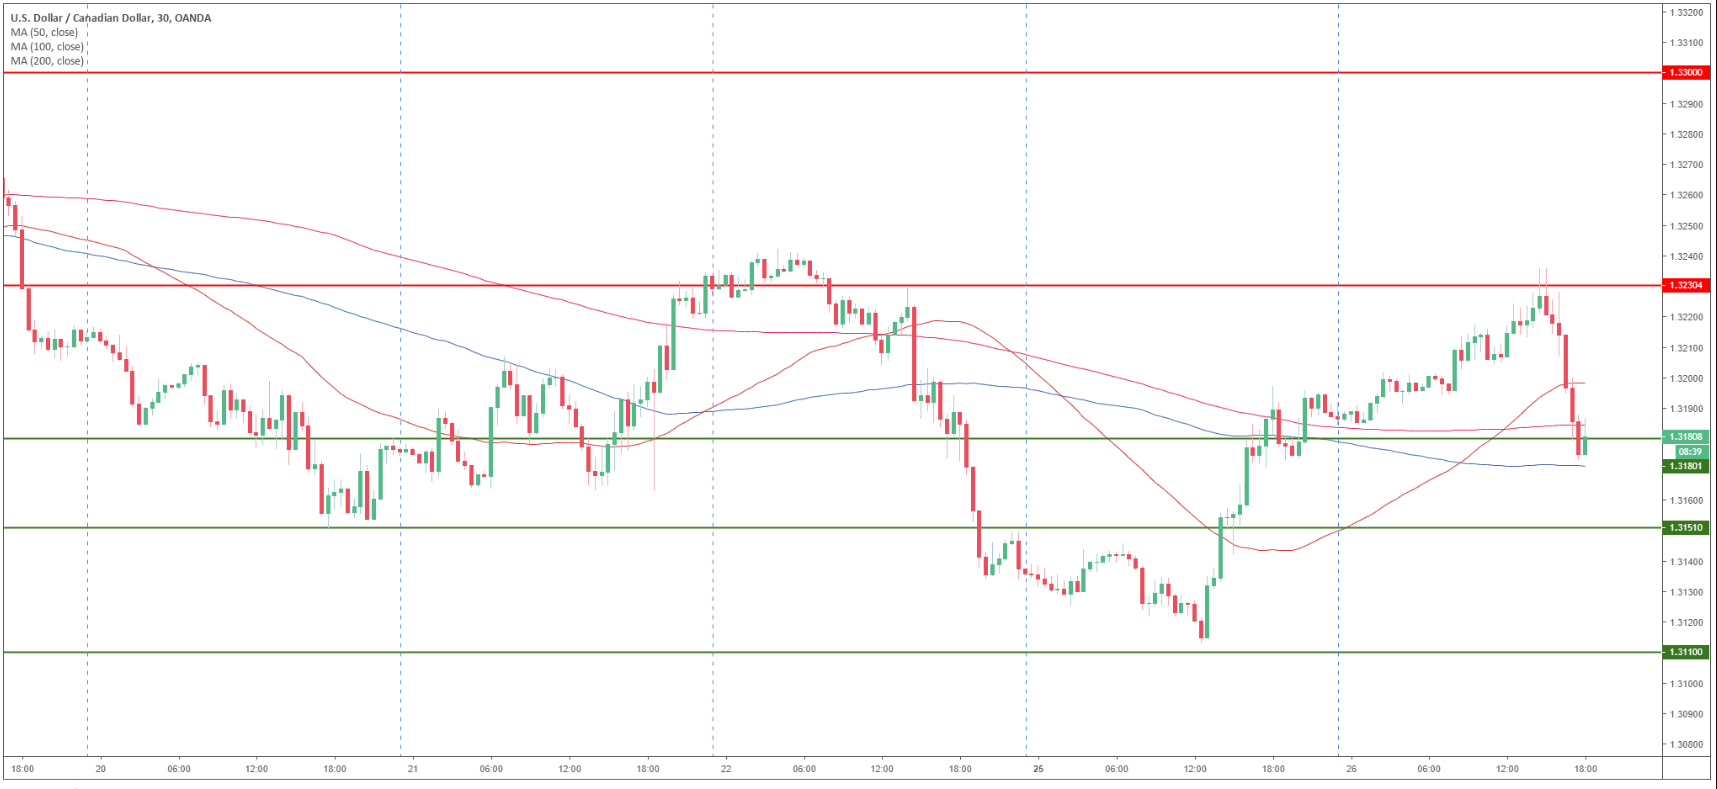
USD/CAD 30-minute chart
- USD/CAD is trading between the 50 and 100 SMA suggesting sideways action in the short-term.
- USD/CAD is testing the 1.3180 support, however, the currency pair is weakening and a drop to 1.3150 and 1.3110 may be on the cards.
- Resistances are at 1.3230 and 1.3300 level.
Additional key levels
USD/CAD
Overview:
Today Last Price: 1.3181
Today Daily change: -13 pips
Today Daily change %: -0.10%
Today Daily Open: 1.3194
Trends:
Daily SMA20: 1.3209
Daily SMA50: 1.3341
Daily SMA100: 1.3264
Daily SMA200: 1.3159
Levels:
Previous Daily High: 1.3198
Previous Daily Low: 1.3112
Previous Weekly High: 1.3294
Previous Weekly Low: 1.3134
Previous Monthly High: 1.3664
Previous Monthly Low: 1.3118
Daily Fibonacci 38.2%: 1.3165
Daily Fibonacci 61.8%: 1.3145
Daily Pivot Point S1: 1.3138
Daily Pivot Point S2: 1.3083
Daily Pivot Point S3: 1.3053
Daily Pivot Point R1: 1.3223
Daily Pivot Point R2: 1.3253
Daily Pivot Point R3: 1.3309
