- USD/CAD is under pressure at levels not seen since July 2019.
- The level to beat for bears is the 1.3084 support.
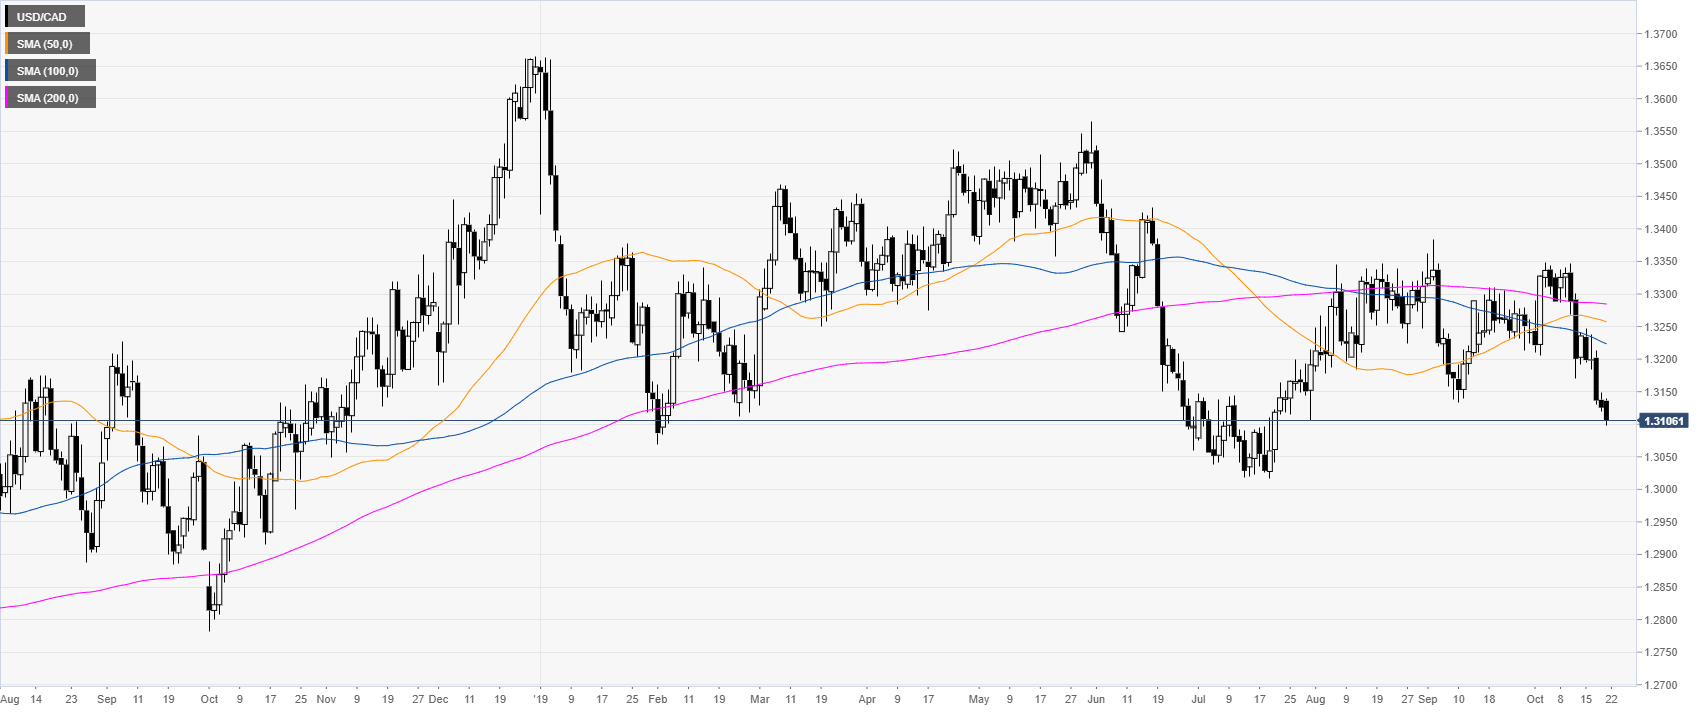
USD/CAD daily chart
USD/CAD, on the daily chart, is trading sideways below the main daily simple moving averages (DSMAs). The market is flirting with the 1.3100 handle this Monday.
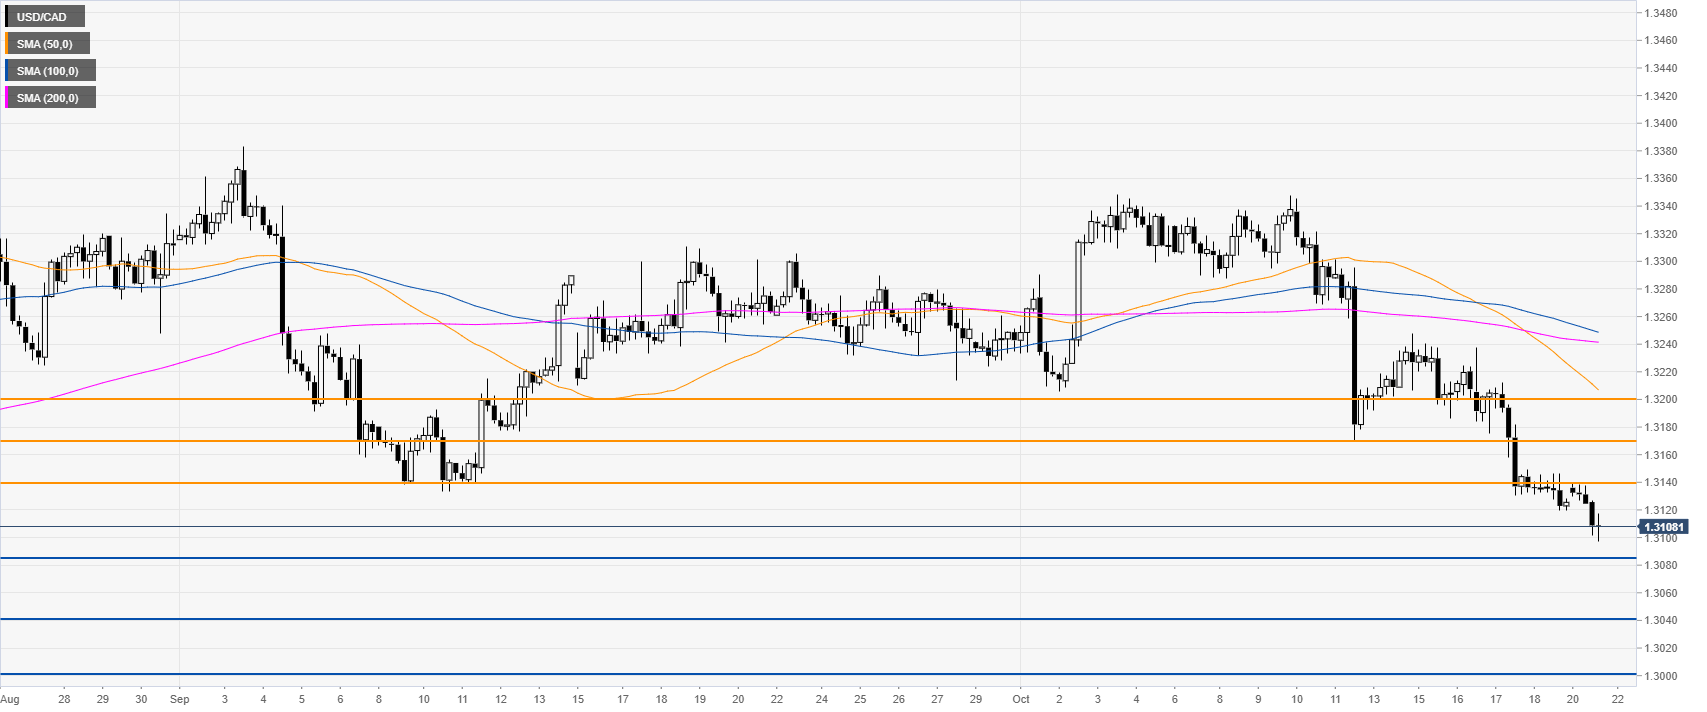
USD/CAD four-hour chart
USD/CAD is under bearish pressure below its main SMAs. The market needs to break below the 1.3084 support in order to potentially trigger further losses towards the 1.3043 level and 1.3000 handle.
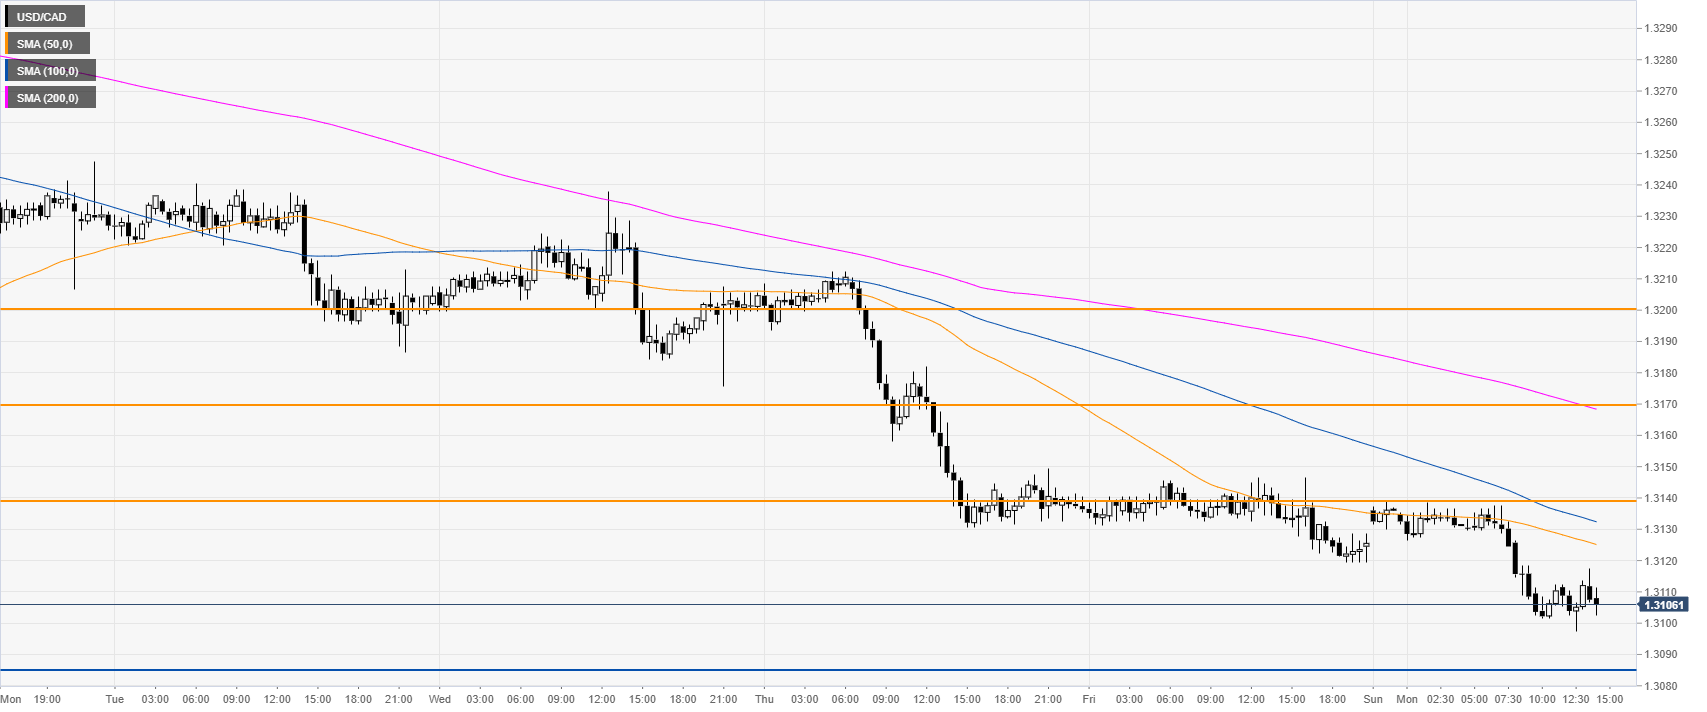
USD/CAD 30-minute chart
USD/CAD is trading below its main SMAs, suggesting bearish momentum in the near term. Resistance is seen at 1.3138, followed by 1.3170 and the 1.3200 handle, according to the Technical Confluences Indicator.
Additional key levels
