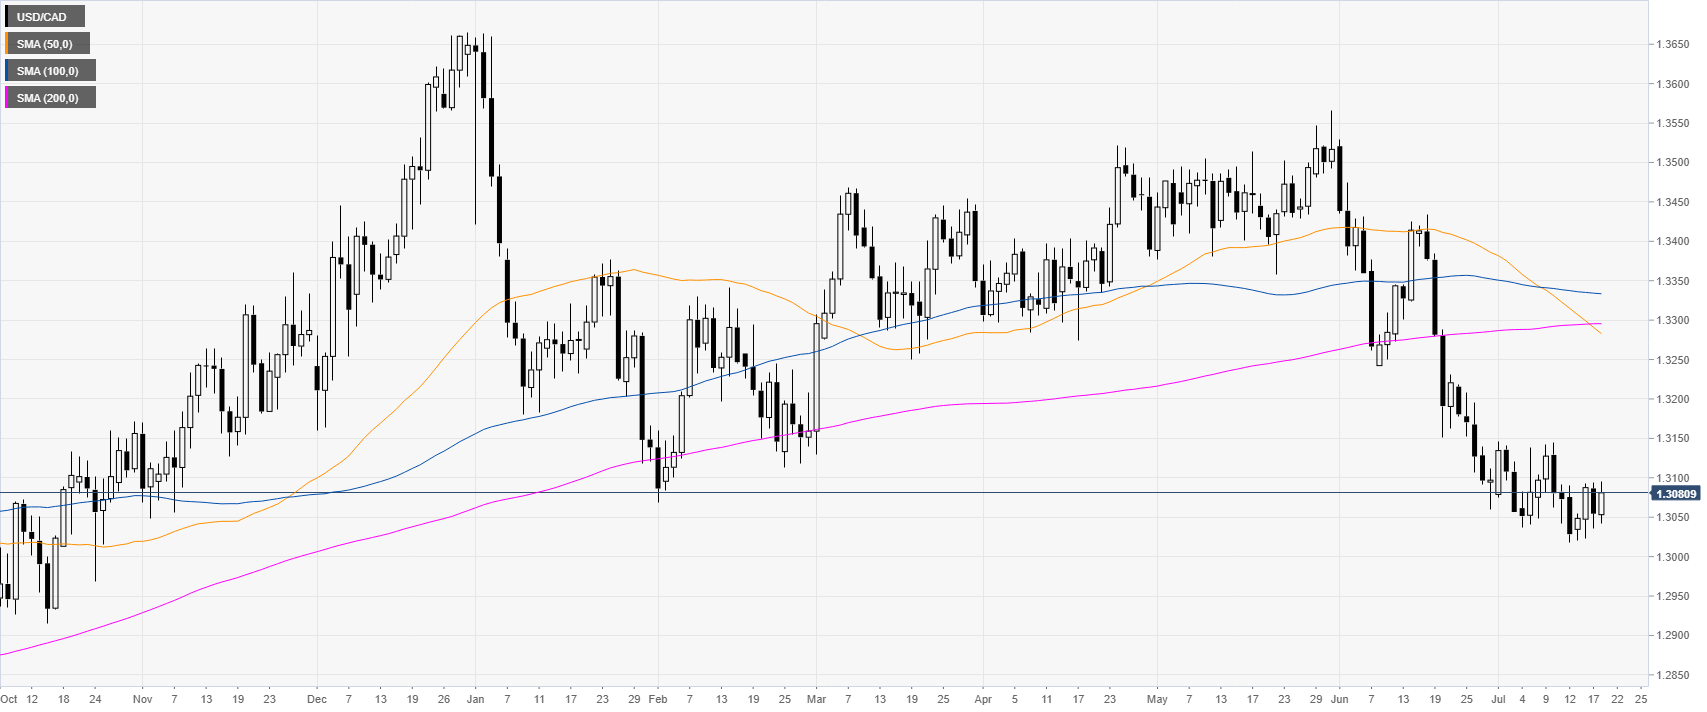
- USD/CAD is hovering close to multi-month lows.
- On a recovery scenario, the levels to beat for buyers can be near 1.3050 and 1.3080/1.3100.
USD/CAD daily chart
USD/CAD is under bearish pressure near multi-month lows as the market is capped below 1.3100 and the main daily simple moving averages (DSMAs).
USD/CAD 4-hour chart
USD/CAD is trading between the 50 and 100 SMAs suggesting a consolidation in the medium-term. Bulls need to overcome 1.3100 to reach 1.3150/70 on the way up, according to the Technical Confluences Indicator.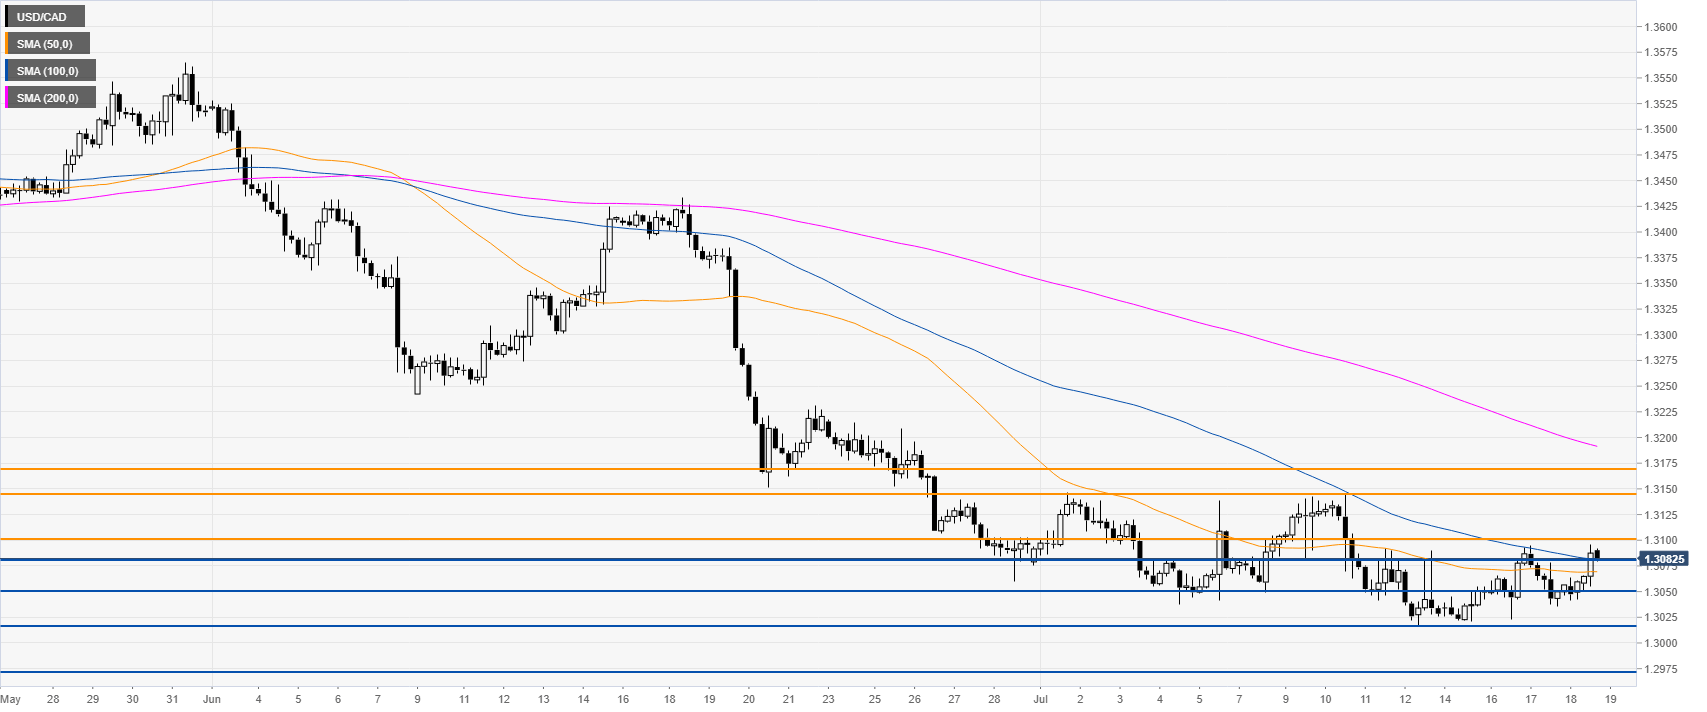
USD/CAD 30-minute chart
USD/CAD is trading above its main SMAs suggesting bullish momentum in the near term. Support is seen at 1.3080, 1.3050 and 1.3015, according to the Technical Confluences Indicator.
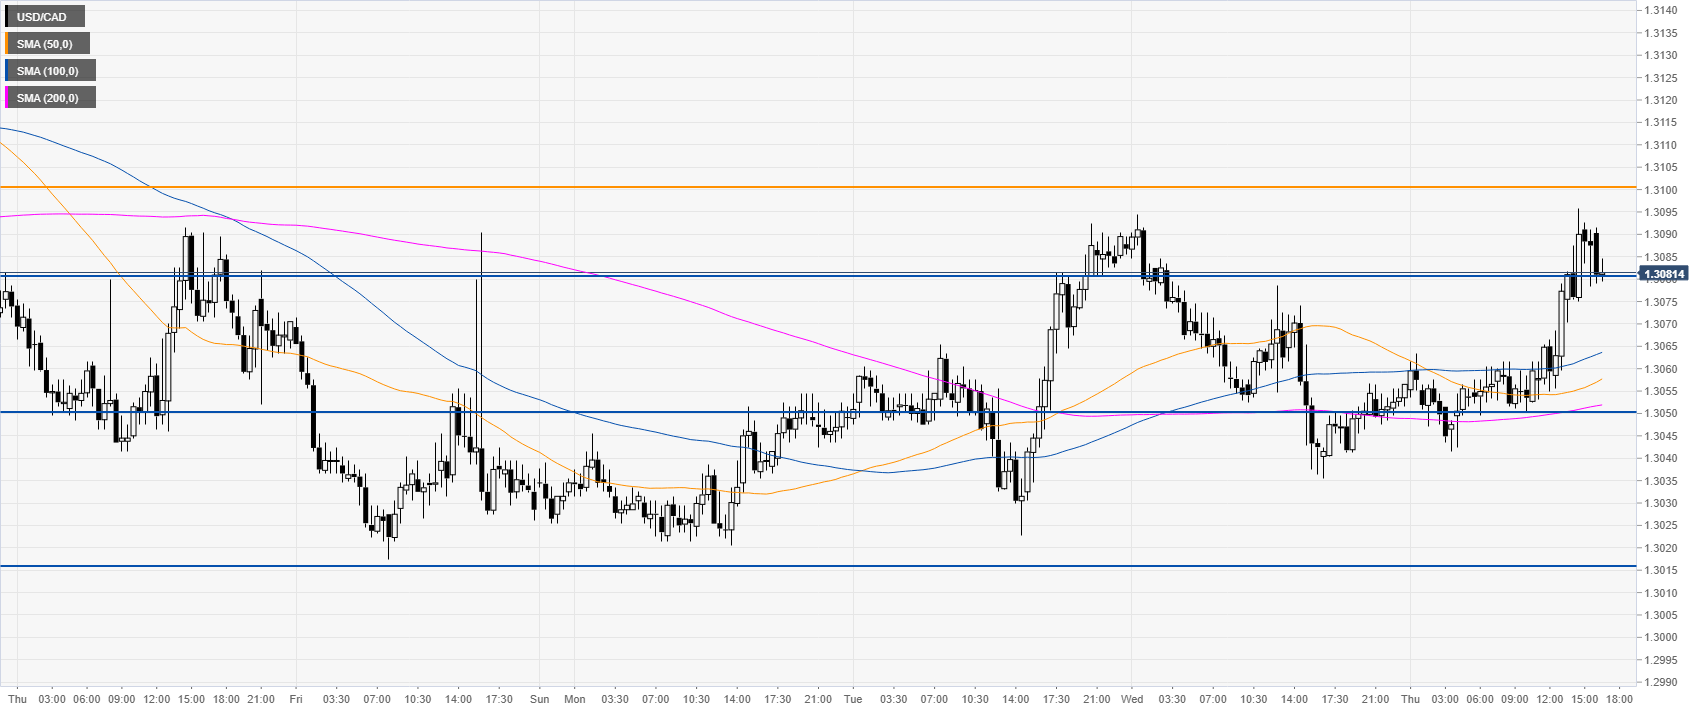
Additional key levels
