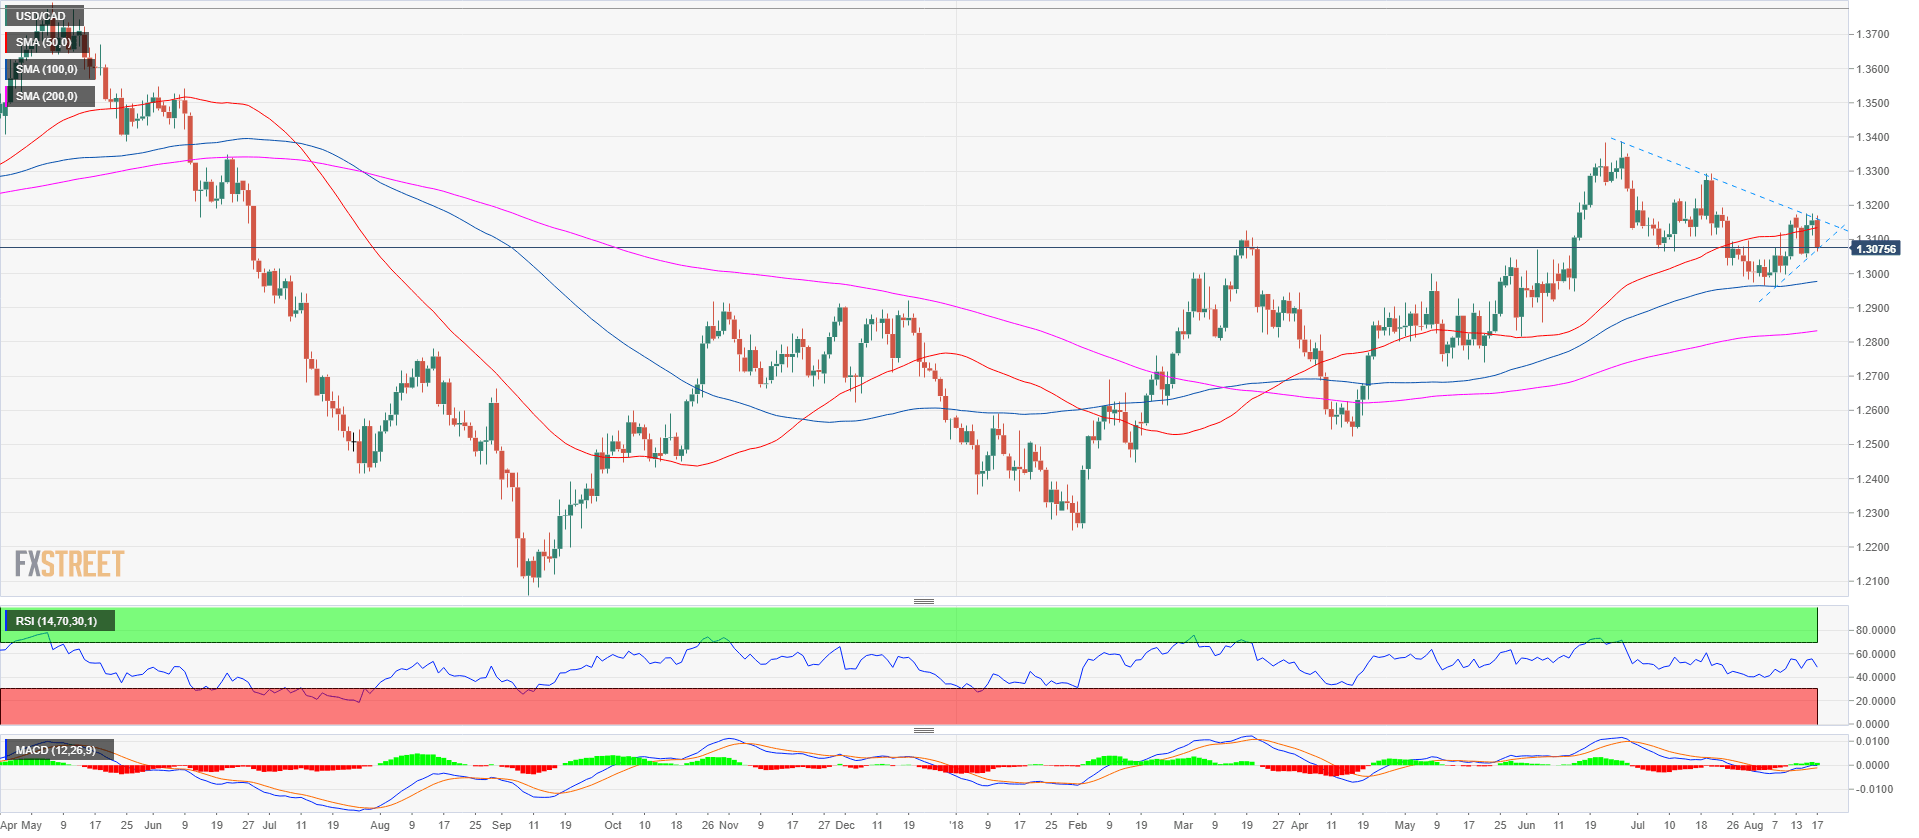
- USD/CAD is having trouble to resume the main bull trend as the pair is facing massive resistance at the 1.3120-1.3155 area and the bearish daily trendline. CAD gained in strength after the release of the Bank of Canada Consumer Price Index Core year-on-year to July came in at 1.6% versus 1.3% forecast.
- USD/CAD is currently supported by the ascending trendline on the daily chart and once bears break below it the target becomes 1.2959 August 7 low. Bears need to break below 1.3048 August 14 low in order to escape the current 1.3050-1.3155 range.
- Since the average daily range has already been reached USD/CAD might enter a consolidation phase and the drop might happen next week.
USD/CAD daily chart
Spot rate: 1.3074
Relative change: -0.60%
High: 1.3171
Low: 1.3063
Trend: Bullish
Short-term Trend: Bearish below 1.3200
Resistance 1: 1.3100 figure
Resistance 2: 1.3120-1.3155 area, supply/demand level and June 18 low
Resistance 3: 1.3172 August 13 swing high
Resistance 4: 1.3200 figure
Resistance 5: 1.3271 June 29 high
Resistance 6: 1.3350 figure
Resistance 7: 1.3388, 2018 high
Resistance 8: 1.3543 June 9, 2017 swing high
Support 1: 1.3048-1.3066 area, August 14 low and July 9 low
Support 2: 1.3022 July 25 low
Support 3: 1.3000 figure
Support 4: 1.2959 August 7 low
Support 5: 1.2900 figure
Support 6: 1.2855 June 6 low
