- USD/CAD remains under pressure below key support-turned-resistance.
- The 23.6% Fibonacci retracement, September low become likely nearby supports to watch.
Following its downside break of near-term key support line, USD/CAD declines to 1.3197during early Asian session on Monday.
The pair now aims to visit 23.6% Fibonacci retracement level of May-July south-run, at 1.3145 whereas September month low close to 1.3130 could please sellers afterward.
It should, however, be noted that the 14-bar Relative Strength Index (RSI) might drop to oversold territory during further declines and could lure counter-trend traders around 1.3130.
On the contrary, pair’s daily closing beyond support-turned-resistance, at 1.3215 now, can trigger fresh pullback to 100-day Simple Moving Average (SMA) level near 1.3240.
However, 50% Fibonacci retracement and 200-day SMA becomes a tough barrier around 1.3285/90 for buyers to confront, which if broken could escalate the recovery to monthly tops surrounding 1.3350.
USD/CAD daily chart
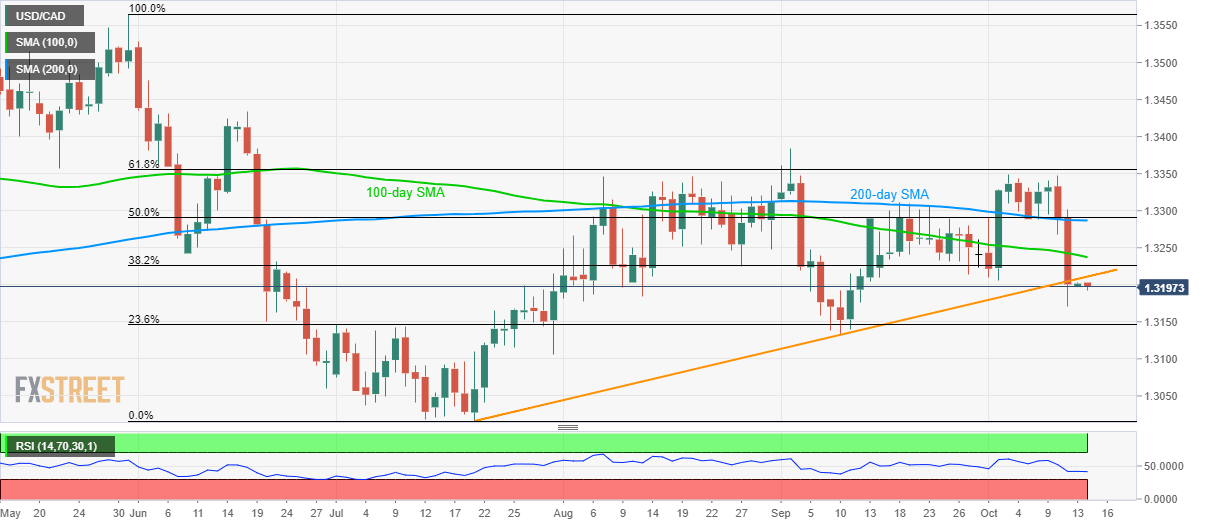
Trend: bearish
