- USD/CAD buyers again aim for 200-day SMA.
- The 11-week-old falling trend line adds to the resistance.
- 23.6% of Fibonacci retracement limit immediate declines.
Having bounced off 100-day SMA, USD/CAD again aims at 200-day SMA while taking the bids to 1.3215 during the Asian session on Tuesday.
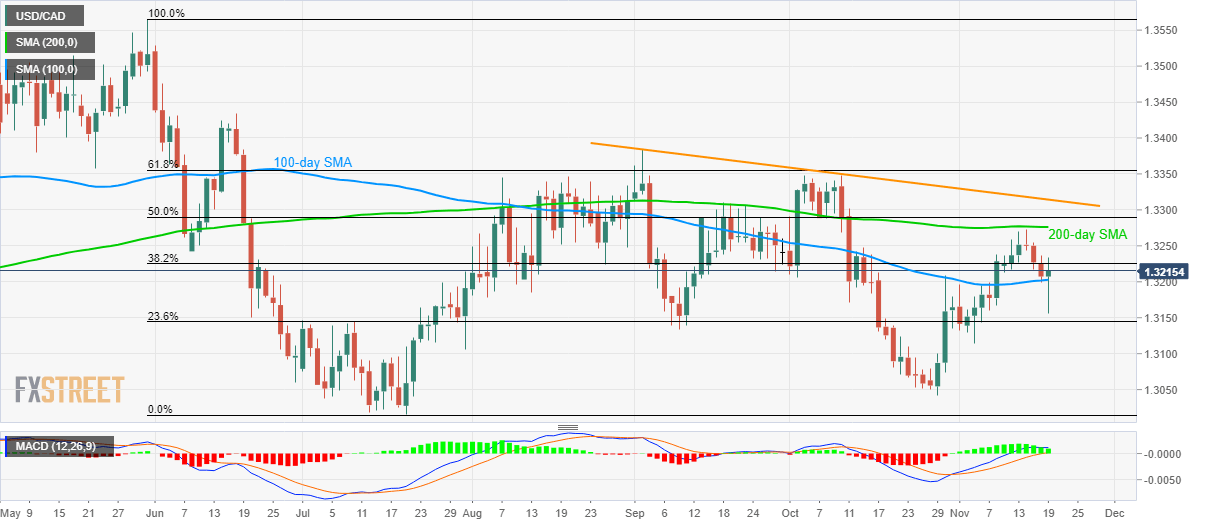
In addition to the 200-day Simple Moving Average (SMA) level of 1.3276, 50% Fibonacci retracement level of June-July downpour at 1.3290 and a descending trend line since September 03 also challenge bulls around 1.3315.
On the downside, pair’s daily closing below 100-day SMA level of 1.3200 could drag it closer to 23.6% Fibonacci retracement, at 1.3145.
Though, any further declines below 1.3145 might not hesitate to drag the pair towards 1.3100/1.3095 support area.
USD/CAD daily chart
Trend: Bearish
