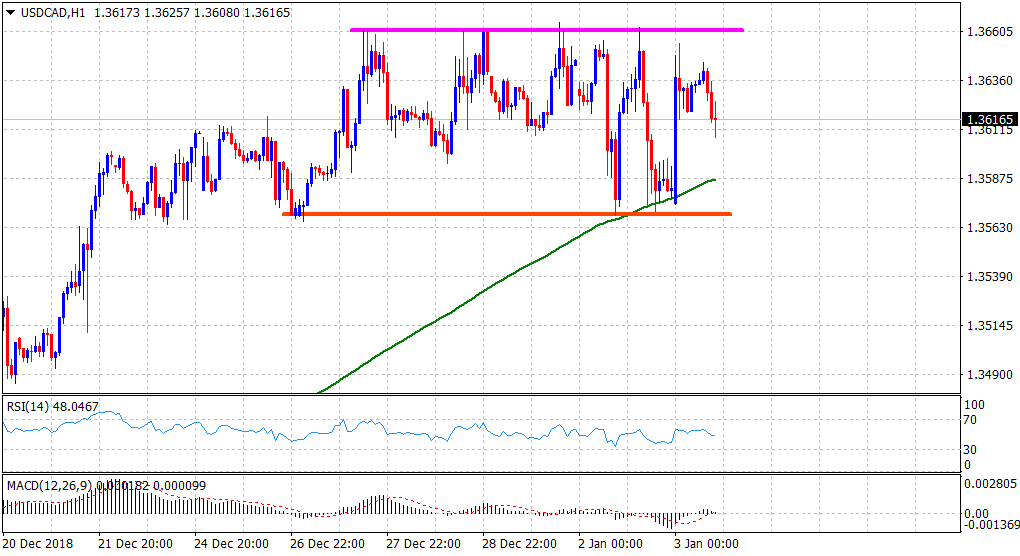
“¢ The pair’s post-Christmas attempted up-moves struggled to make it through the 1.3660 supply zone, though bulls have managed to defend 200-hour SMA.
“¢ The range-bound price action, forming a rectangular chart pattern, might still be categorized as a consolidation phase that marks a pause in the bullish trend.
“¢ Although seen as a continuation pattern, rectangle sometimes also mark significant trend tops or bottoms and is not complete until a breakout has occurred.
“¢ Hence, it would be prudent to wait for a convincing breakthrough the above-mentioned barrier before traders start positioning for a fresh leg of an up-move.
“¢ Meanwhile, the downside remains protected by 200-hour SMA, which is followed by the lower end of the recent trading range, around the 1.3570-65 region.
“¢ A convincing break through the said support levels might negate the bullish outlook and prompt some aggressive long-unwinding trade in the near-term.
USD/CAD 1-hourly chart
USD/CAD
Overview:
Today Last Price: 1.3614
Today Daily change: 32 pips
Today Daily change %: 0.236%
Today Daily Open: 1.3582
Trends:
Previous Daily SMA20: 1.3523
Previous Daily SMA50: 1.3328
Previous Daily SMA100: 1.3171
Previous Daily SMA200: 1.307
Levels:
Previous Daily High: 1.3664
Previous Daily Low: 1.3568
Previous Weekly High: 1.4134
Previous Weekly Low: 1.3564
Previous Monthly High: 1.4134
Previous Monthly Low: 1.316
Previous Daily Fibonacci 38.2%: 1.3605
Previous Daily Fibonacci 61.8%: 1.3627
Previous Daily Pivot Point S1: 1.3546
Previous Daily Pivot Point S2: 1.351
Previous Daily Pivot Point S3: 1.3451
Previous Daily Pivot Point R1: 1.3641
Previous Daily Pivot Point R2: 1.37
Previous Daily Pivot Point R3: 1.3736
