Home USD/CAD Technical Analysis: price holding above the bearish triangle’s resistance
FXStreet News

USD/CAD Technical Analysis: price holding above the bearish triangle’s resistance

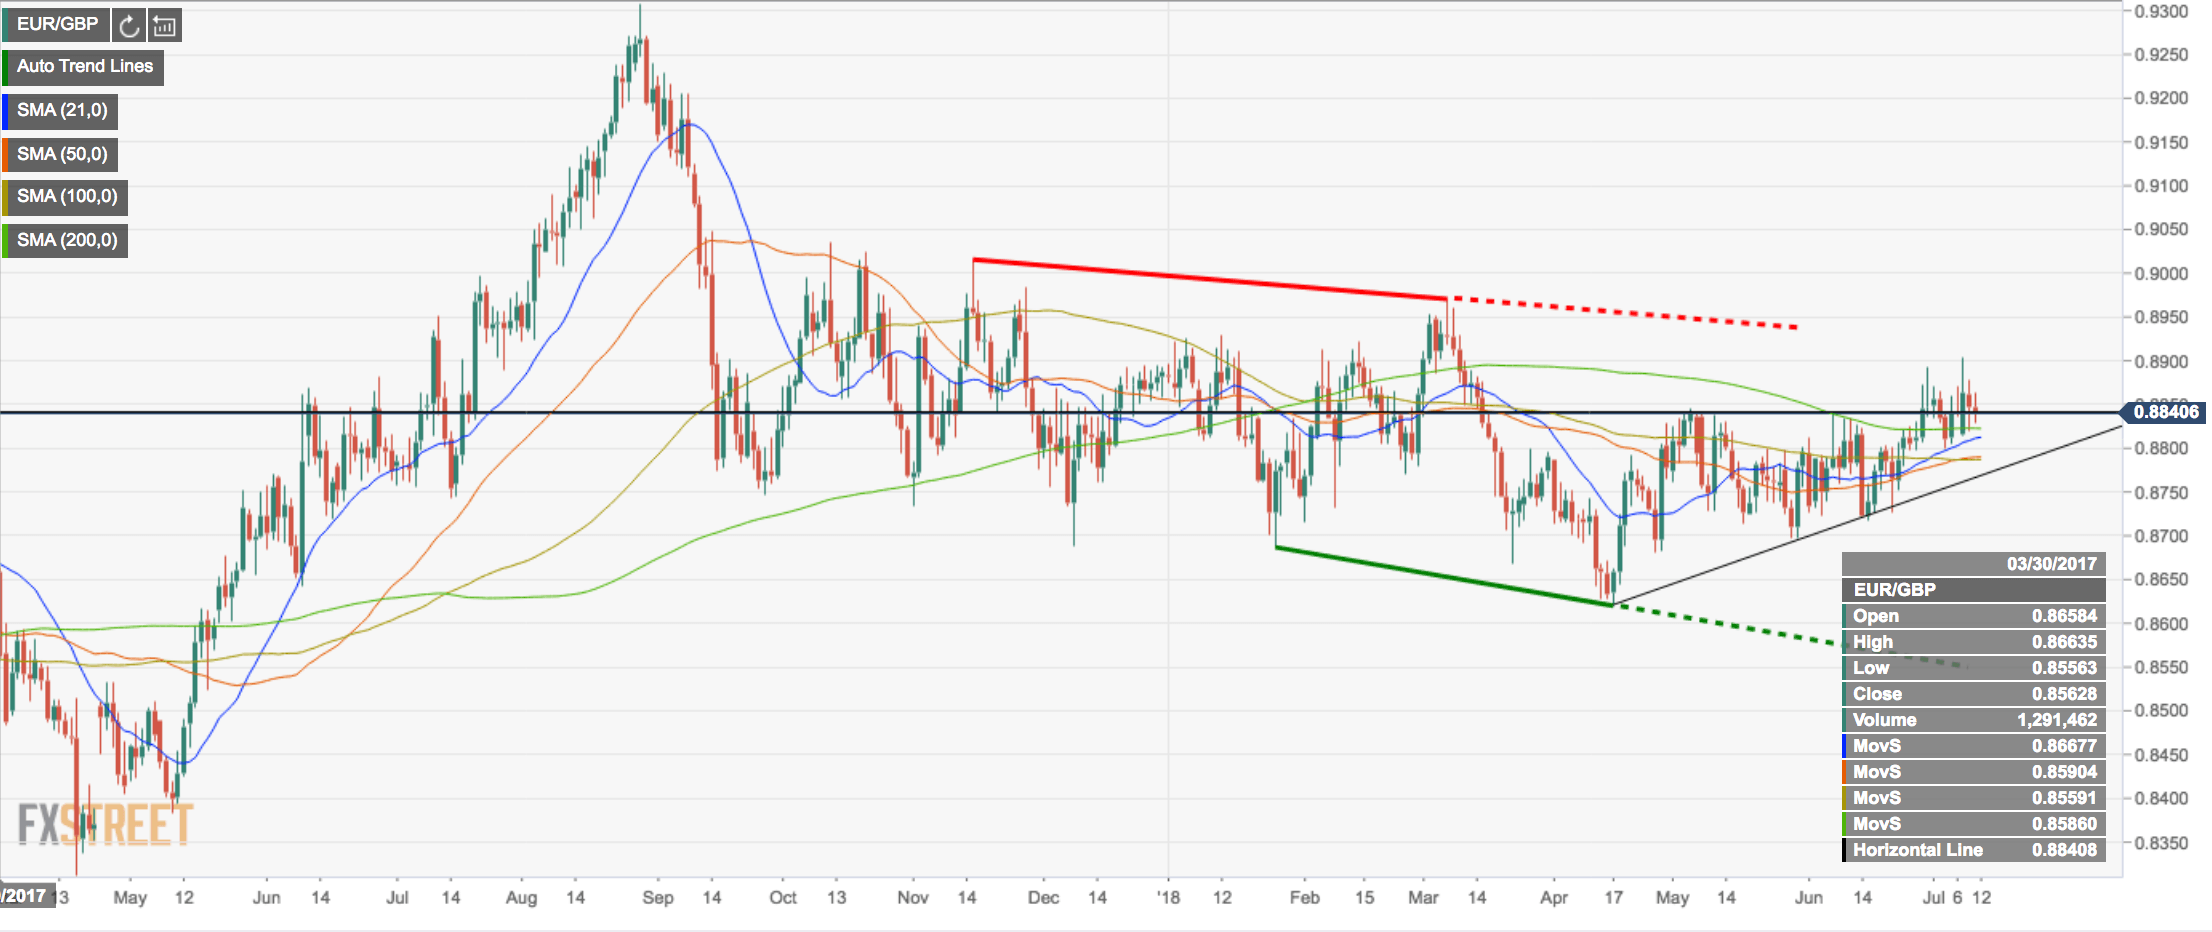
  • EUR/GBP is osciliating around the 10-D SMA with the price holding abovethe bearish triangle’s resistance.
  • Dips are bought at the rising  21-D SMA while RSI points to a period of consolidation on the daily sticks.  

Spot rate:                    0.8840
High:                           0.8843
Low:                            0.8838

Trend:                        Bullish while above bearish triangle resistance.  
 
Resistance 1:             0.8880
Resistance 2:             0.8943 (5th May tops).          
Resistance 3:             The 0.9034 October 2017 high on the wide is a key upside.

       
Support 1:                  0.8847 (10-D SMA)          
Support 2:                  0.8813 (21-D SMA)  
Support 3:                  0.8620 protects  a run towards 0.8526 as being  the 78.6% retracement of the move from 2017 on the wide.            

FX Street

FX Street

FXStreet is the leading independent portal dedicated to the Foreign Exchange (Forex) market. It was launched in 2000 and the portal has always been proud of their unyielding commitment to provide objective and unbiased information, to enable their users to take better and more confident decisions.