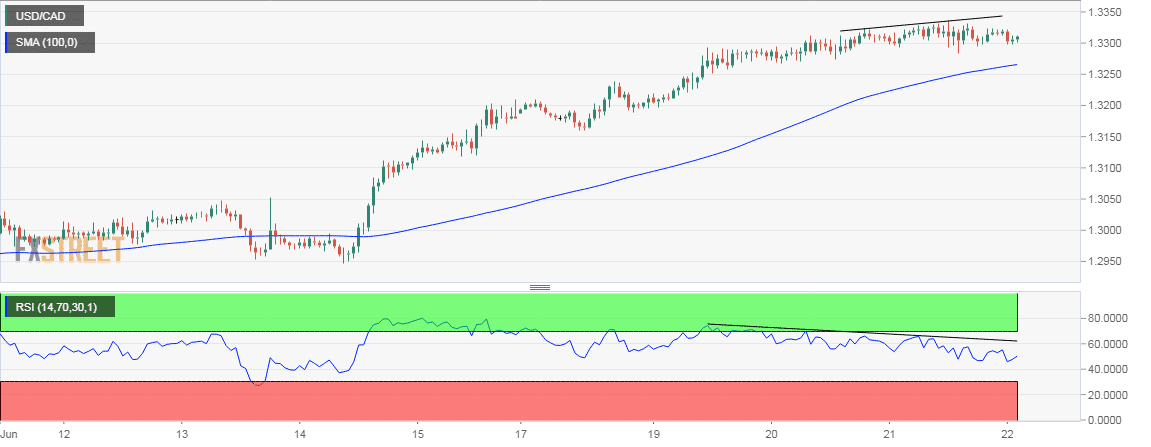
- The USD/CAD hourly chart shows a bearish price-relative strength index (RSI) divergence, adds credence to signs of bullish exhaustion, as represented by Thursday’s doji candle, and oversold conditions as indicated by the daily RSI.
- The pair could fall back to 100-hour moving average (MA) support, currently located at 1.3265.
Hourly chart
Spot Rate: 1.3307
Daily High: 1.3322
Daily Low: 1.3300
Trend: Bearish, overbought conditions
R1: 1.3335 (previous day’s high)
R2: 1.3385 (76.4% Fib R of April 2017 high – September 2017 low)
R3: 1.35 (psychological hurdle)
Support
S1: 1.3265 (100-hour moving average)
S2: 1.32 (psychological support)
S3: 1.3163 (ascending 10-day moving average)
