- USD/CAD buyers fall short of clearing 1.3245/50 resistance-confluence.
- 50% Fibonacci retracement, 200-bar SMA adds to the resistance.
Following its failure to rise past near-term key trend lines, USD/CAD witnesses a pullback to 1.3225 during Tuesday’s Asian session.
Not only a downward slopping trend line connecting tops marked since last week but an upward sloping resistance line (previous support) ranging from early September also contributes to highlighting 1.3245/50 as a tough nut to crack for buyers.
As a result, prices are likely to revisit 23.6% Fibonacci retracement of September month declines, at 1.3193 ahead of diverting sellers to 1.3160 and 1.3130 rest-points.
On the contrary, pair’s successful break above 1.3250 needs to clear 1.3255/60 area comprising 50% Fibonacci retracement and 200-bar Simple Moving Average (SMA) to justify its strength in targeting 1.3290 and 1.3310 numbers to the north.
USD/CAD 4-hour chart
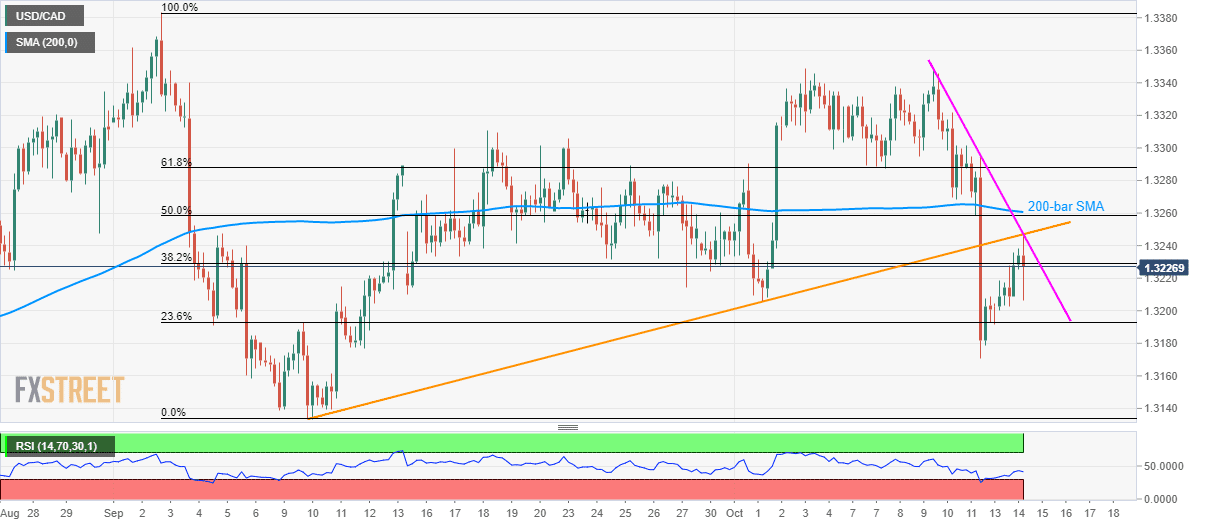
Trend: pullback expected
