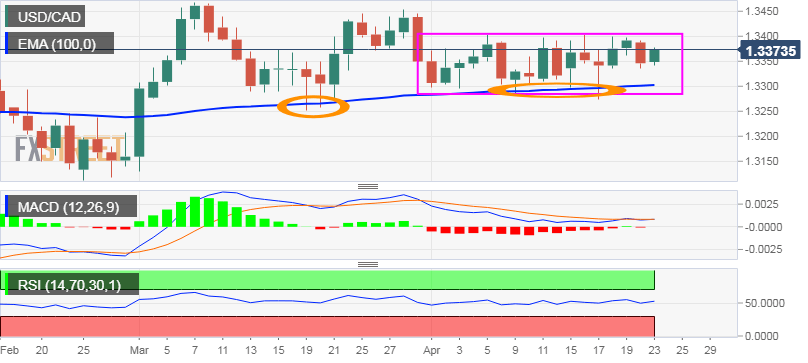
“¢ The pair’s good two-way price action, well within a broader trading range over the past three weeks or so, constituted towards the formation of a rectangle on the daily chart.
“¢ The fact that the pair has been showing some resilience near 100-day EMA clearly points to the prevalent dip-buying interest and support prospects for additional gains.
“¢ Positive oscillators on hourly charts add credence to the constructive outlook, albeit maintained their neutral bias on the daily chart and warrant some caution for bullish traders.
“¢ Hence, it would be prudent to wait for a sustained move beyond the 1.3400 handle, trading range hurdle, before positioning for any further near-term appreciating move.
USD/CAD daily chart