- Failure to hold recent highs, slip beneath 23.6% Fibonacci retracement portrays the USD/CAD pair’s weakness.
- Momentum indicators also flash signs of bulls’ exhaustion.
Not only failure to rise beyond short-term ascending resistance-line but decline below 23.6% Fibonacci retracement of latest up-moves since mid-July also portrays the USD/CAD pair’s bullish exhaustion while it trades near 1.3200 during early Monday.
Adding to the bearish signals are 14-bar relative strength index (RSI) and 12-bar moving average convergence and divergence (MACD).
With this, the pair can aim for 50% Fibonacci retracement around 1.3140 during further declines. However, 100-bar moving average (4H 100MA) at 1.3120 could restrict additional downpour, if not then 1.3090 could be on sellers’ radar.
On the upside, 1.3235 and a recent high near 1.3267 may please buyers during the pullback ahead of challenging them with nine-day-old ascending trend-line, at 1.3270.
USD/CAD 4-hour chart
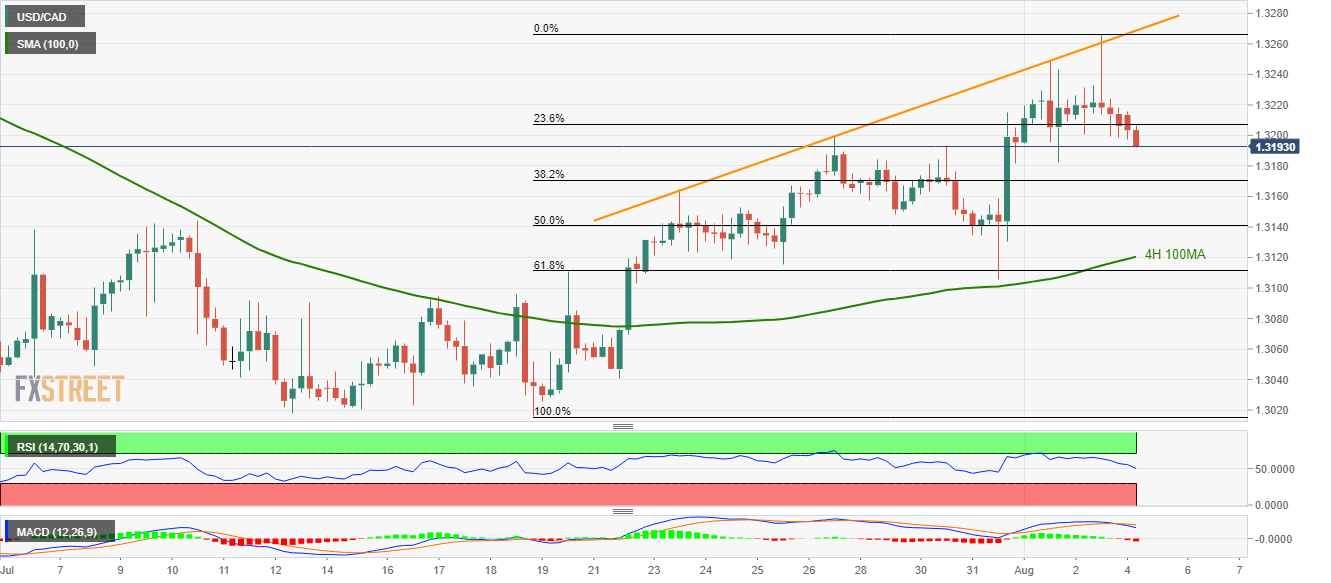
Trend: Bearish
