- USD/CAD bulls want to keep the main trend alive by supporting the market above 1.3000 figure.
- USD/CAD is attempting a rebound from the 1.3000 figure as the RSI and Stochastics are moving up from oversold condition, which can be seen as reversal attempt from bulls. However, the flat 100 and 200-period simple moving averages (SMA) and the falling 50 SMA is indicative of a trading range market and as it stands moves might be limited by the 1.3108 and 1.3200 resistances which can become the next targets.
- A bear breakout below 1.2973 would invalidate the bullish bias.
USD/CAD 4-hour chart
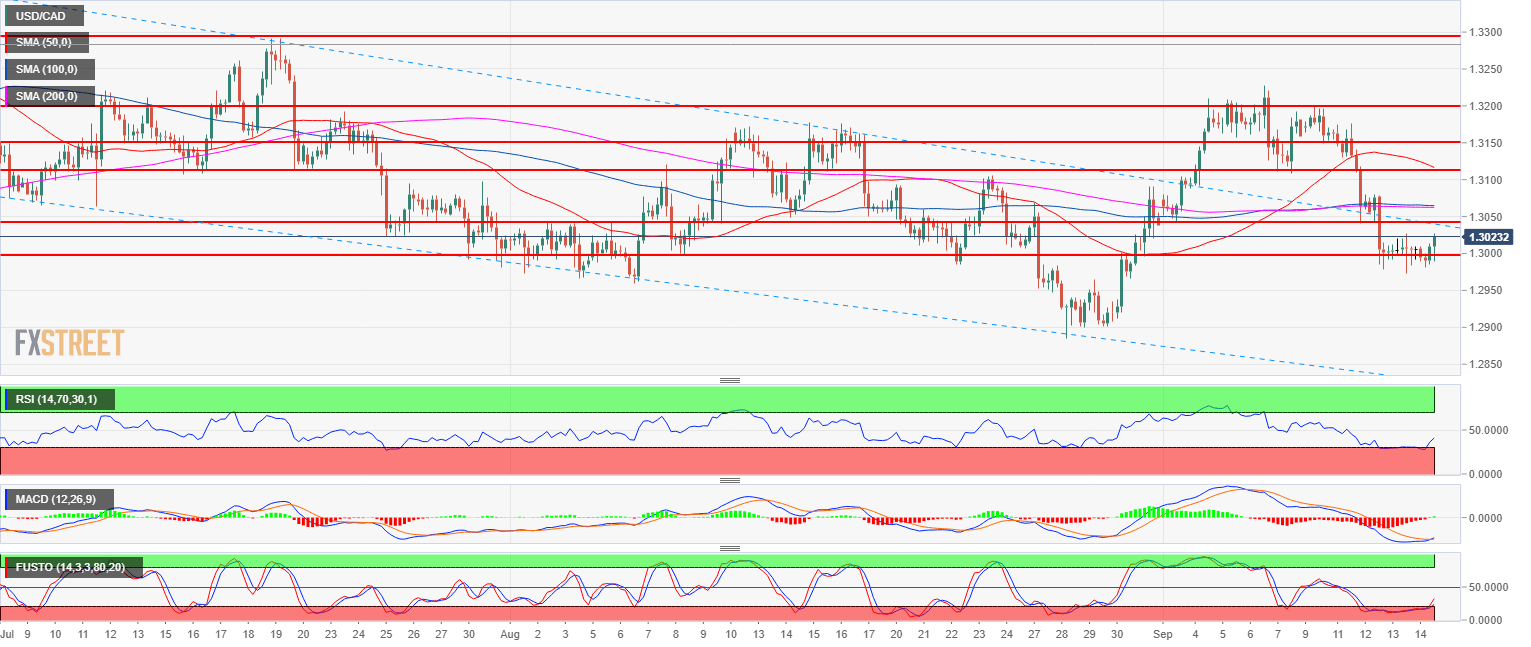
Spot rate: 1.3019
Relative change: 0.17%
High: 1.3028
Low: 1.2981
Trend: Bullish
Resistance 1: 1.3048 August 14 low
Resistance 2: 1.3108, September 7 low
Resistance 3: 1.3155 June 18 low
Resistance 4: 1.3172 August 13 swing high
Resistance 5: 1.3200 figure
Resistance 6: 1.3300 figure
Resistance 7: 1.3388, 2018 high
Support 1: 1.3000 figure
Support 2: 1.2959 August 7 swing low
Support 3: 1.2855 June 6 low
